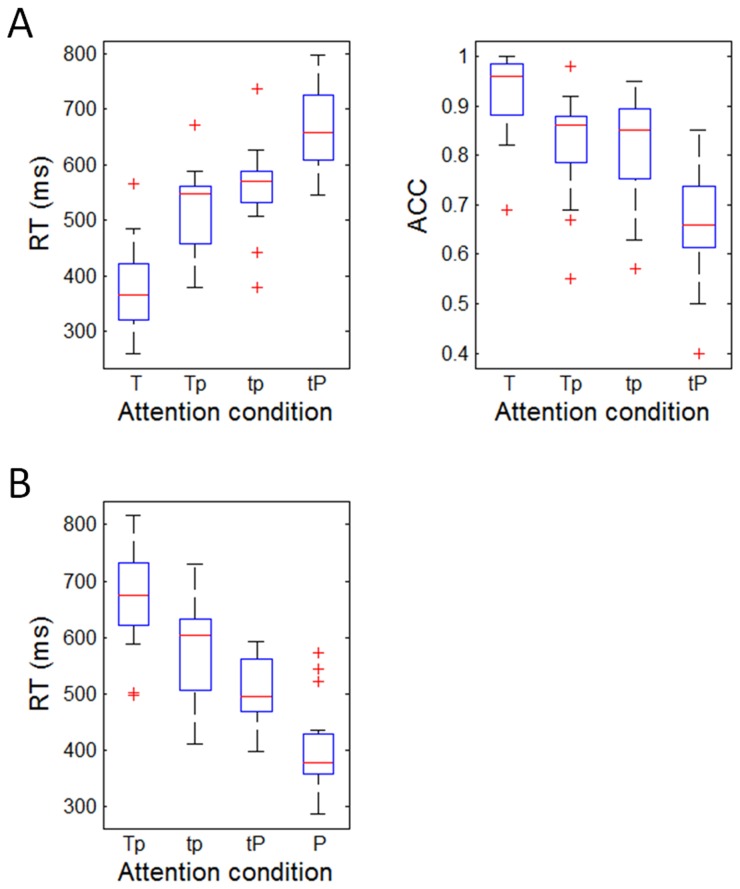
Figure 2. Behavioral results.
A, the measurements of reaction time (RT) and accurate rate (ACC) in time discrimination task. B, the RT in pitch discrimination task. Shown are the boxplots of medians of RT and ACC in different attention modulation conditions. The three horizontal lines in every box reflect the lower quartile (25%), median (50%), and upper quartile (75%) of the statistics, respectively. The whisker is equal to one interquartile range of the statistics. The “+” marks represent outliers outside of the whisker.

