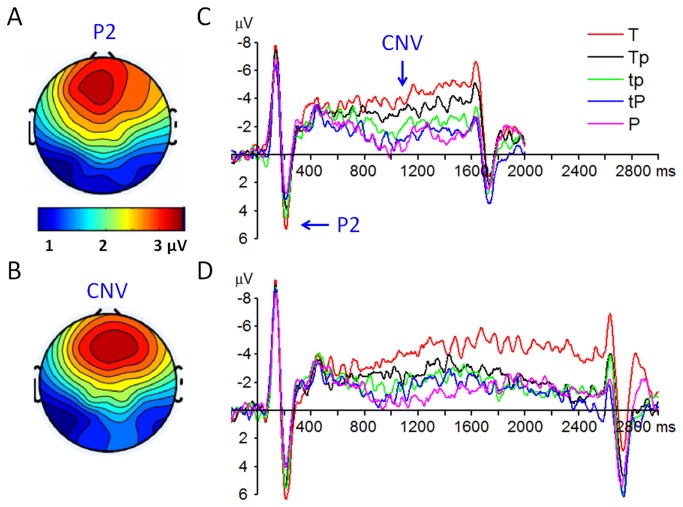
Figure 3. Grand-mean ERP waveforms and topographies of the P2 and CNV components.
A, the P2 topography at 180-220 ms post-stimuli. B: the CNV topography at 800-1600 ms post-stimuli. C, the ERP waveforms (at FCz electrode site) in response to the 1.5-s tone. D, the ERP waveforms (at FCz electrode site) in response to the 2.5-s tone.

