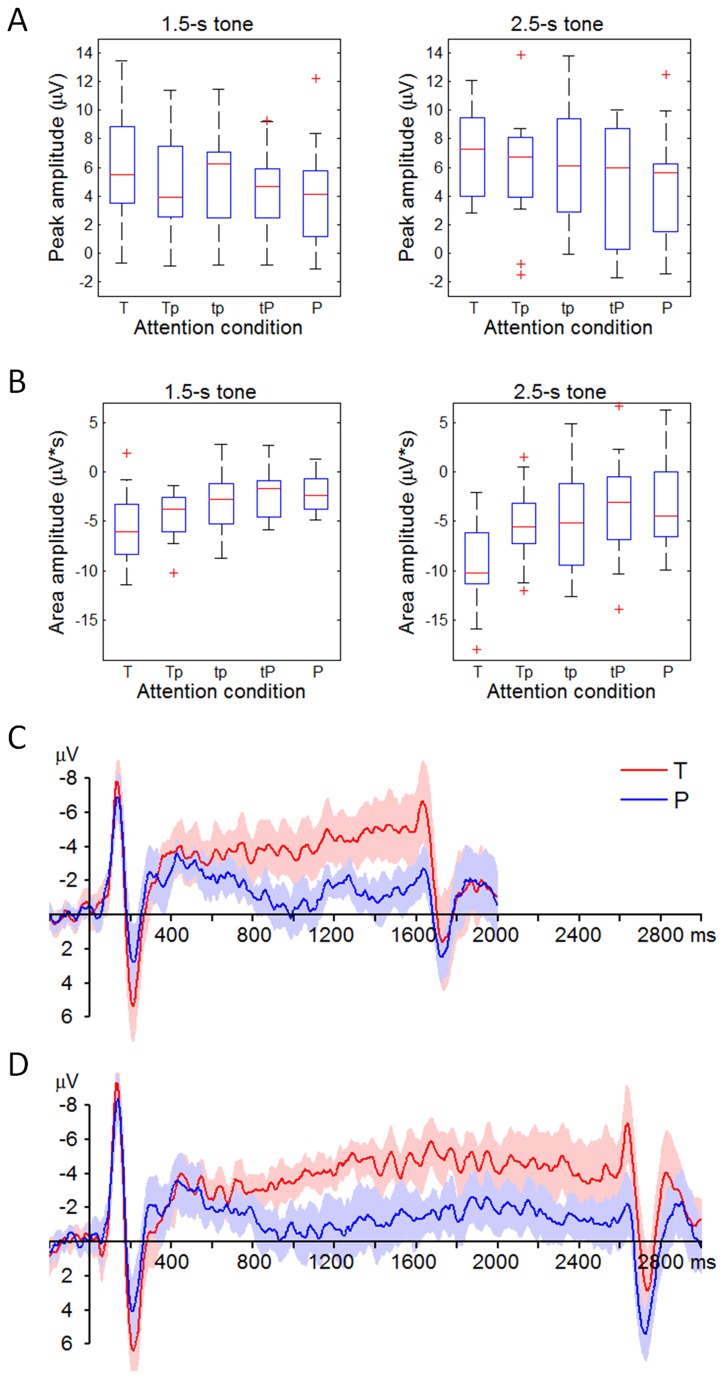
Figure 4. Distribution of ERP measurements in different attention conditions (data are collected at the electrode of FCz).
A, the distribution of P2 amplitudes. The three horizontal lines in every box reflect the lower quartile (25%), median (50%), and upper quartile (75%) of the P2 amplitudes (refer to the legend of Figure 2 for more details). B, the distribution of CNV amplitudes. C, the average and 95% confidential interval (CI) of the ERPs in response to the 1.5-s tone. For the sake of brevity, only the ERPs in the T and the P conditions are displayed. D, the average and 95% CI of the ERPs in response to the 2.5-s tone.

