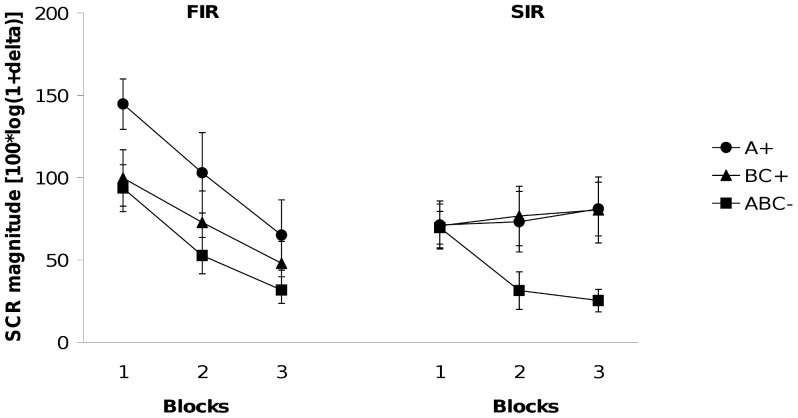
Figure 2. Experiment 2.
Mean magnitudes of skin conductance responses during acquisition. (Left-hand panel shows first interval responses [FIR]; right-hand panel shows second interval responses [SIR]). Responses are shown in blocks of two trials for reinforced stimuli, A+ and BC+, and in blocks of four trials for ABC-.

