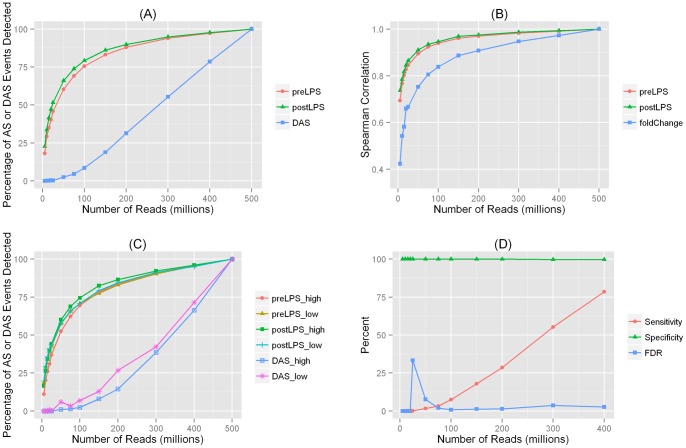
Figure 2. Analysis results for alternative splicing (AS) and differential AS (DAS) in adipose.
(A) Percentage of detected alterantive splicing (AS) and differential AS (DAS) events for datasets with various sequencing depths. PreLPS: detection rate for AS events in the pre-LPS sample; postLPS: detection rate for AS events in the post-LPS sample; DAS: detection rate for DAS events. (B) Spearman correlation between exon or intron inclusion levels in datasets with various sequencing depths and inclusion levels in the 500 M-read datasets. PreLPS: correlation of inclusion levels in the pre-LPS sample; postLPS: correlation of inclusion levels in the post-LPS sample; fold-change: correlation of the fold change of isoform ratios. (C) Percentage of detected AS and DAS events according to gene expression levels. preLPS_high: detection rate for AS in highly expressed genes in the pre-LPS sample; preLPS_low: detection rate for AS in lowly expressed genes in the pre-LPS sample; postLPS_high: detection rate for AS in highly expressed genes in the post-LPS sample; postLPS_low: detection rate for AS in lowly expressed genes in the post-LPS sample; DAS_high: detection rate for DAS in highly expressed genes; DAS_low: detection rate for DAS in lowly expressed genes. (D) Performance of DAS events detected in datasets with various sequencing depths.

