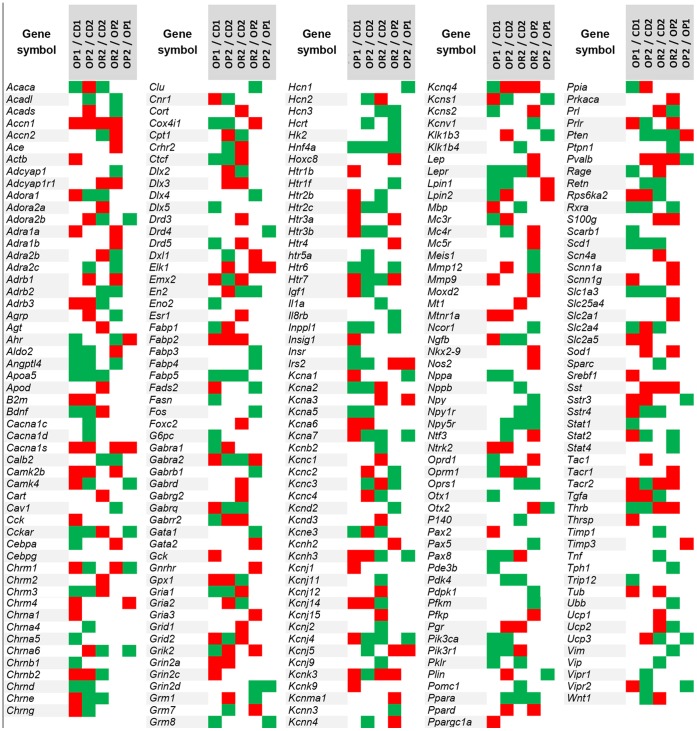
Figure 2. Heat map construction representing the differential expression of genes involved in metabolic function and neurotransmission.
The heat map shows changes in the hepatic expression of genes encoding proteins involved in neurotransmission and genes encoding energy homeostasis-related proteins. Red, green and white squares represent upregulated, downregulated and unmodified genes, respectively.

