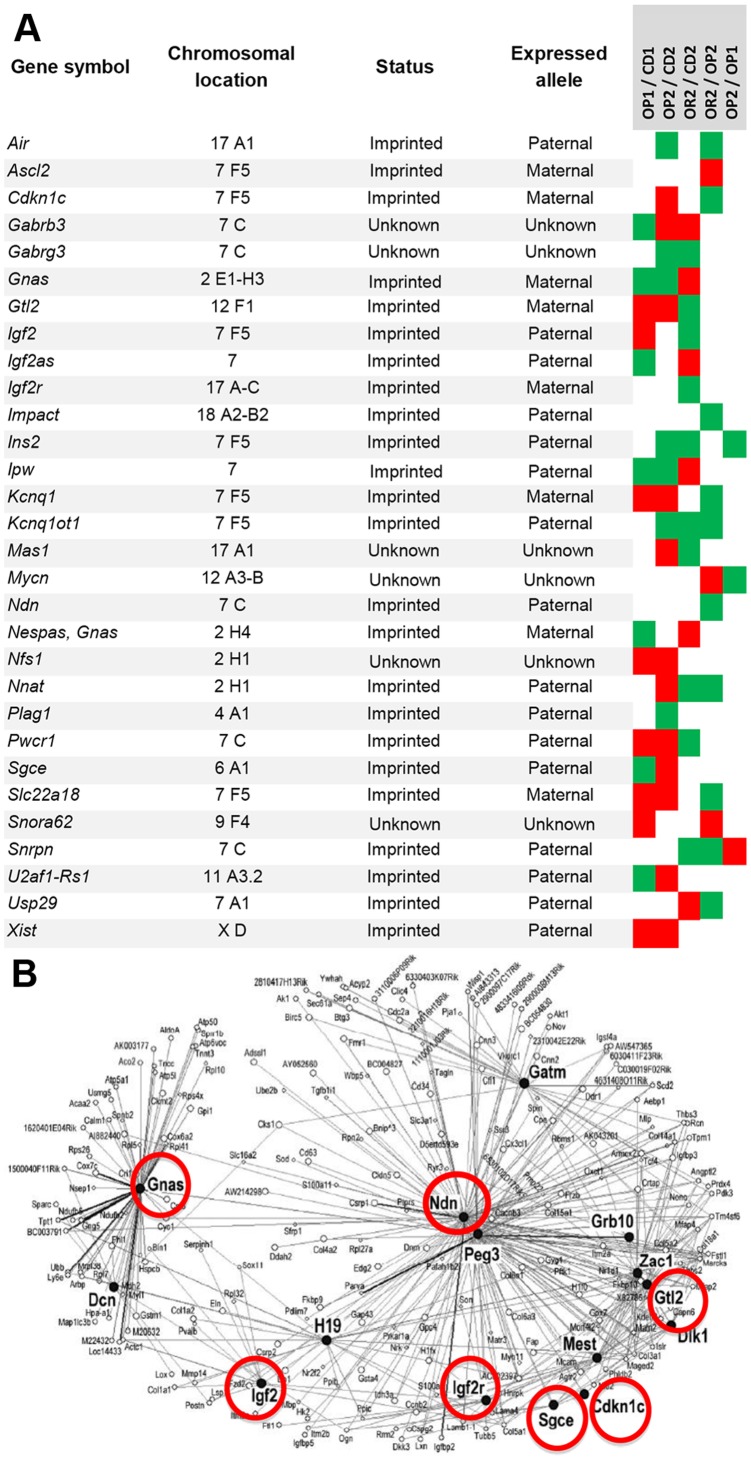
Figure 3. Heat map construction representing differentially expressed imprinted genes.
(A) The heat map shows the changes in expression of imprinted genes in the liver in response to the HFD (OP1/CD1, OP2/CD2, OR2/CD2), with the trait of susceptibility/resistance to the obesogenic effects of HFD (OR2/OP2; indirect comparisons OR2/CD2 and OP2/CD2), or with a maternal effect (lean versus obese mother) (OP1/OP2); indirect comparisons (OP1/CD1 and OP2/CD2). Red, green and white squares represent upregulated, downregulated and unmodified genes, respectively. The status of the imprinted gene and the preferred parental allele for gene expression presented in this table at this time may subsequently be modified, as knowledge in this domain increases. Updates accessible via www.geneimprint.com). (B) Representation of the IGN network as described by Varrault et al. [50]. Red circles indicate the genes modulated in OR2 mice in response to the HFD and associated with maintenance of the lean phenotype (comparisons OR2/CD2 and OR2/OP2).

