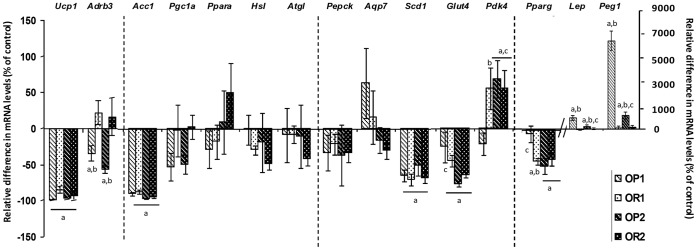
Figure 4. Analysis of mRNA levels for key adipogenic genes by RT-qPCR on the adipose tissue of mice fed either the CD or the HFD, born to either lean or obese/diabetic mothers (F1LM and F2OM).

The values shown are the ratios between OP1 or OR1 and CD1 and between OP2 or OR2 and CD2 (Figures 9 and 10). They are expressed as the mean±SEM, n = 6 per group. a p<0.05 for comparison with control CD, b p<0.05 for comparison between OP and OR mice, c p<0.05 for comparison between F1LM and F2OM, assessed by Kruskal-Wallis tests followed by post hoc Dunn’s tests.
