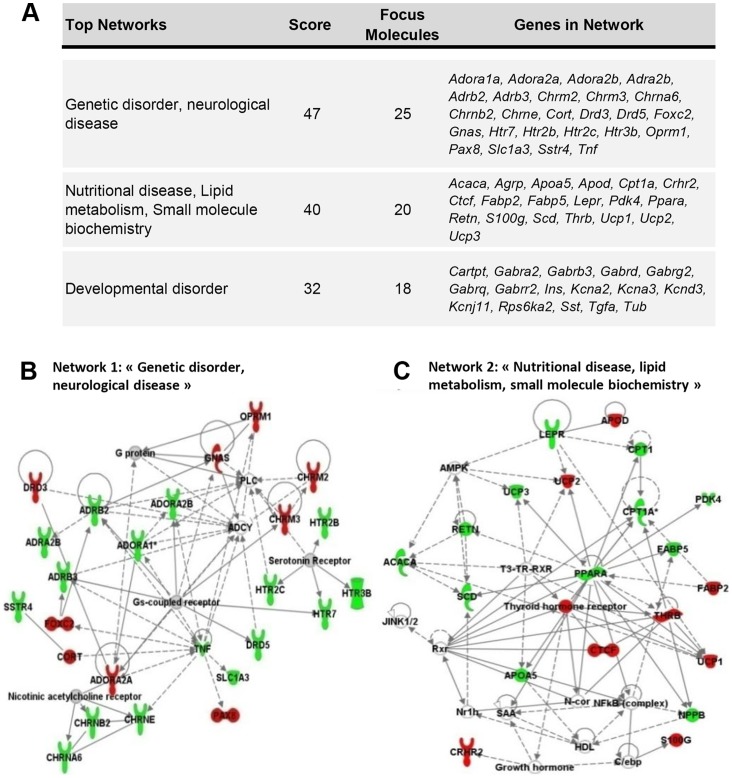
Figure 6. Resistance to the obesogenic effects of the HFD: Major networks identified by IPA analysis of the genes involved in the response and adaptation to HFD of OR2 mice.
(A) These networks were built from the 142 genes differentially expressed between OR2 and CD2 mice (direct comparison OR2/CD2). Only the first two networks are represented in (B) and (C). The node color indicates the level of expression of the genes: red, upregulated; green, downregulated.

