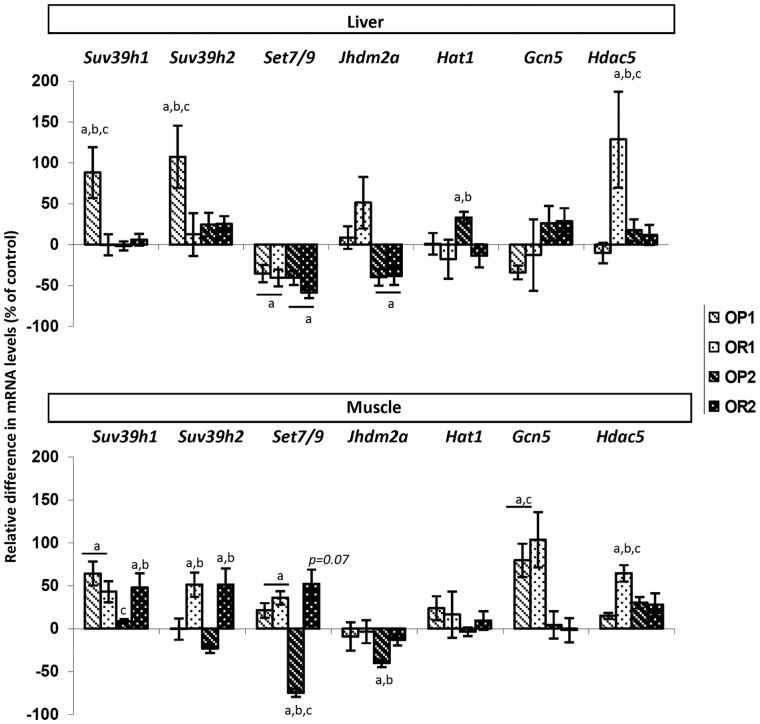
Figure 10. Analysis, by RT-qPCR, of the expression of genes encoding histone-modifying enzymes in the liver and muscle of mice fed the HFD, for both lean and obese mothers.
The values shown are the ratios between OP1 or OR1 and CD1 and between OP2 or OR2 and CD2. They are expressed as the mean±SEM, n = 8 per group. a p<0.05 for comparison with control CD, b p<0.05 for comparison between OP and OR mice, c p<0.05 for comparison between the F1LM and F2OM (maternal effect: lean versus obese mother), assessed by Kruskal-Wallis tests and post hoc Dunn’s tests.

