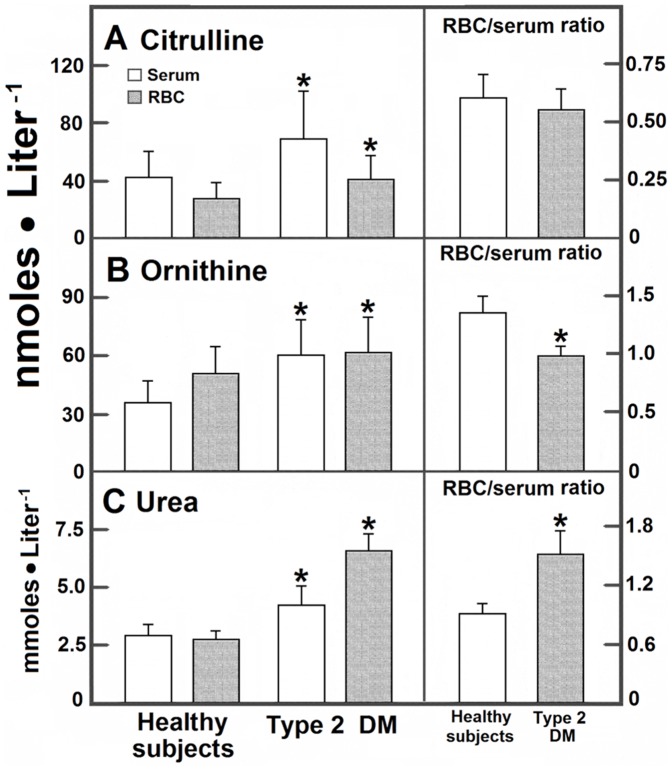
Figure 2. Serum and RBC levels of citrulline, ornithine, and urea from blood obtained from control subjects and patients with type 2 diabetes mellitus.
The results are expressed as the mean ± SD for levels of blood citrulline (panel A), ornithine (panel B), or blood urea (panel C) in RBC samples from control healthy volunteers (n = 90) and in patients with type 2 diabetes mellitus (n = 90). Symbols indicating each experimental group at the top of the panels. Statistics as indicated in Fig. 1.

