
Figure 3. Methods to analyze 4C-seq.
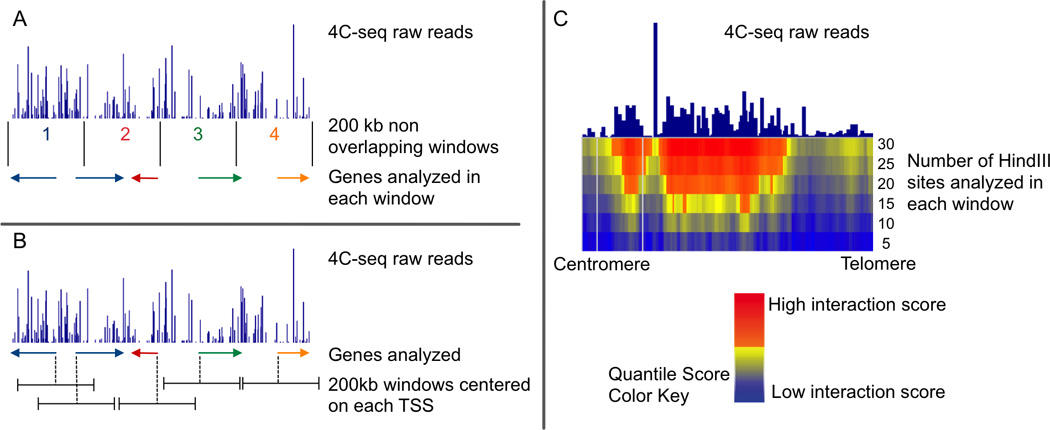
A and B represent different approaches to gene centric 4C-seq analyses. (A) The method used by the Casellas lab divides the genome into non overlapping 200 kb windows. The total number of 4C-seq reads that map to each window are quantified and normalized relative to the total number of genome-wide reads. Genes are assigned within a window depending on their most upstream RefSeq genomic location (NCBI Reference Sequence). All genes that start within the same 200 kb window will have the same 4C score. (B) In contrast, the method we used for gene-centric 4C analysis assigns each gene to its own distinct 200 kb window, which is centered on the location of its transcription start site (TSS). To identify which genes have a statistically significant interaction with the bait, signals associated with each gene are compared with the overall 4C-seq signal using an empirical resampling approach. (C) We also used a domainogram approach to analyze 4C-seq. For the construction of domainograms, no anchors (such as gene location or windows based on genomic positions) are used. For each mapped read, a Quantile Score is calculated using windows of increasing numbers of restriction enzyme sites. The enzyme HindIII is used to define window size as the reads in a 4C-seq experiment can only be mapped to these sites. This method calculates the significance of an interaction by comparing local enrichment of the 4C signal.