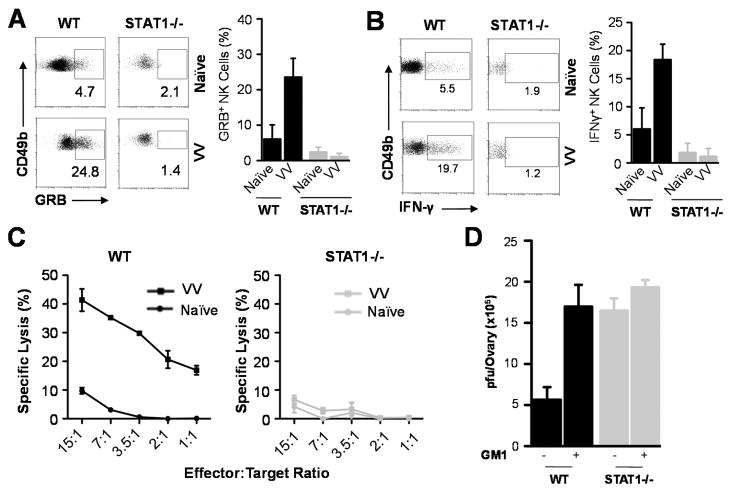
FIGURE 3.
Impaired NK cell function in STAT1−/− mice. WT and STAT1−/− mice were infected with 2×10⁶ pfu of VV intraperitoneally or left uninfected (Naïve). Mice were sacrificed 36 h r after infection and splenic NK cells were assayed for intracellular IFN-γ and Granzyme B (GRB) production and lytic activity. (A) FACS plots of intracellular Granzyme B production by NK cells are shown with the percentage of Granzyme B positive cells among CD49b+CD3− NK cells indicated. The mean percentage ± SD of Granzyme B positive cells among CD49b+CD3− NK cells is provided (n = 6). (B) FACS plots of intracellular IFN-γ production by NK cells are shown with the percentage of IFN-γ positive cells among CD49b+CD3− NK cells indicated. The mean percentage ± SD of IFN-γ positive cells among CD49b+CD3− NK cells is provided (n = 6). (C) NK cell lytic activity was assayed on YAC-1 cells at different effector:target ratios. Naïve splenocytes from WT and STAT1−/− mice were used as the respective controls. The mean percentage ± SD of specific lysis is indicated (n = 4). (D) Some mice were depleted of NK cells with anti-Asialo GM1 antibody (+GM1), or without depletion (−GM1), and the ovaries were harvested for measurement of viral load. Data represents viral titer ± SD as pfu per ovary (n = 4). Data shown is representative of three independent experiments.

