
Figure 4. Prostaglandin E2 levels released from LPS-stimulated BV-2 microglia and primary astrocyte cultures.
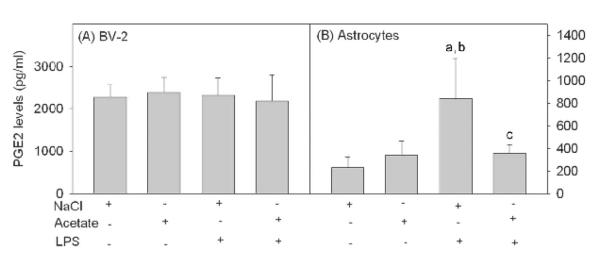
Media levels of secreted PGE2 from BV-2 microglia (panel A) and primary astrocyte cell cultures (panel B) stimulated with LPS and/or acetate as determined using an enzyme-linked immunoassay. Bars represent means ± SD where statistical significance was set at p ≤ 0.05. Abbreviations are: a = compared to NaCl-treated group, b = compared to sodium acetate-treated group and c = compared to LPS + sodium acetate-treated group (n = 6 per group).