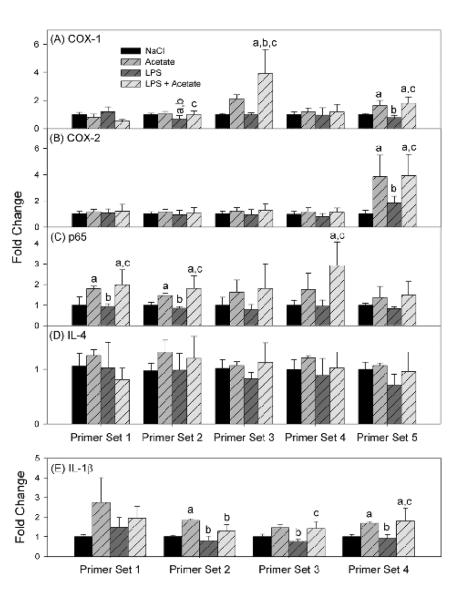
Figure 5. Effect of H3K9 acetylation on binding to transcription start sites of inflammatory genes in BV-2 cultures.
Binding levels of acetylated H3K9 to regions corresponding to ptgs1 (panel A), ptgs2 (panel B), p65 (panel C), il4 (panel D), and il1b (panel E) genes measured using Chromatin immunoprecipitation analysis followed by qrt-PCR. Bars represent means ± SD where statistical significance was set at p ≤ 0.05. Abbreviations are: a = compared to NaCl-treated group, b = compared to sodium acetate-treated group and c = compared to LPS + sodium acetate-treated group (n = 6 per group).

