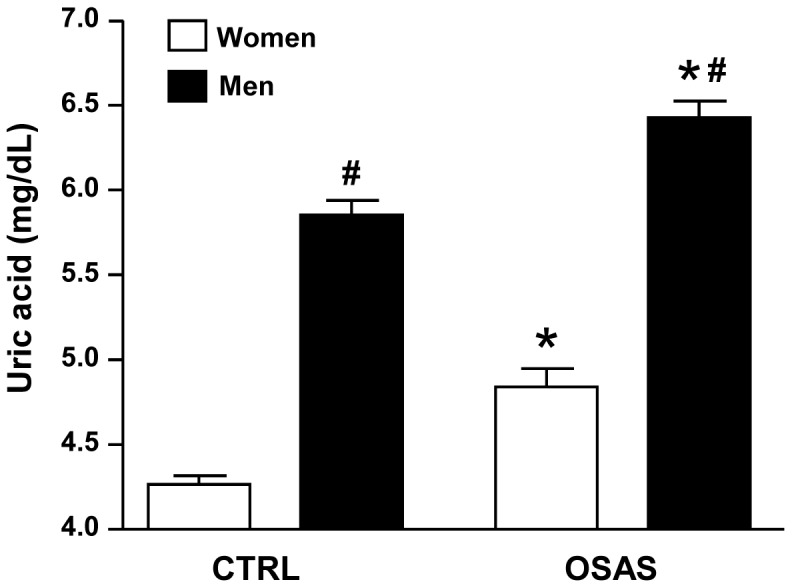
Figure 1. Serum uric acid levels in control (CTRL) and obstructive sleep apnea syndrome (OSAS) groups stratified by gender.

Data are shown as mean±SEM. *p<0.0001 compared to respective CTRL group; #p<0.0001 compared to women gender.

Data are shown as mean±SEM. *p<0.0001 compared to respective CTRL group; #p<0.0001 compared to women gender.