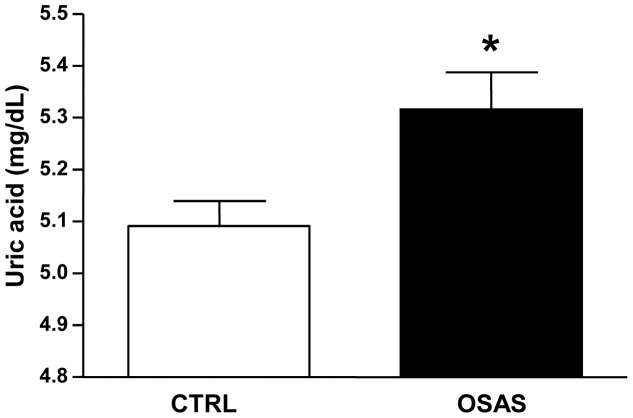
Figure 2. Adjusted mean±SEM of uric acid levels (mg/dL) covariated by body mass index (BMI)-categorical, age-categorical, gender, race-ethnicity, social class and other cardiovascular risk factors (SBP, cholesterol, LDL, HDL, triglycerides and glicemia) in control (CTRL) and obstructive sleep apnea syndrome (OSAS) groups.
*p<0.05 compared to CTRL group.

