
Fig. 2.
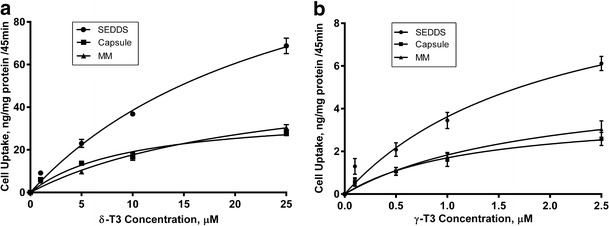
Cellular uptake (ng/mg protein/45 min) following incubation with various concentrations of a δ-T3 and b γ-T3 loaded SEDDS, MM, or capsule. Each value represents the mean ± SD from three independent experiments
Official websites use .gov
A
.gov website belongs to an official
government organization in the United States.
Secure .gov websites use HTTPS
A lock (
) or https:// means you've safely
connected to the .gov website. Share sensitive
information only on official, secure websites.
Cellular uptake (ng/mg protein/45 min) following incubation with various concentrations of a δ-T3 and b γ-T3 loaded SEDDS, MM, or capsule. Each value represents the mean ± SD from three independent experiments