
Fig. 3.
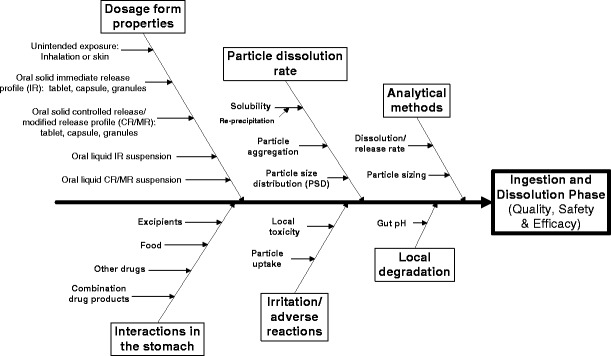
Representative Ishikawa diagram for orally administered drugs. This diagram represents potential risks to safety, quality, and efficacy at the ingestion and dissolution phase for orally administered drugs that have a change in API particle size. Please note that this example diagram is not meant to be a comprehensive depiction of the risk analysis process