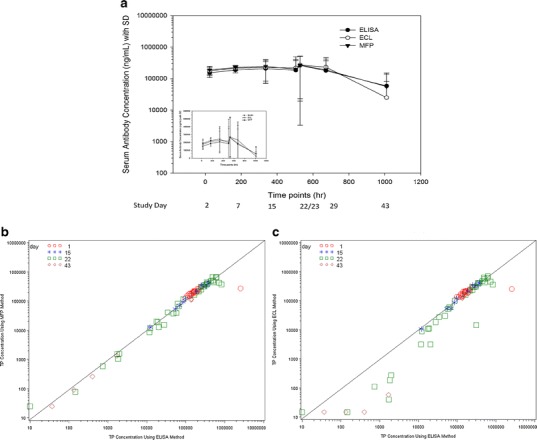
Fig. 2.

Concentration–time profiles of TP after the subcutaneous administration of 50 mg/kg in rats (a) showing in both log and linear scales (inset). TP concentrations were measured by ELISA, ECL, and MFP. Correlation of ELISA to MFP (b) or ECL (c) in measurement of serum TP concentrations with reference to samples from different collection days. Correlation was observed between ELISA and MFP (b) all the time points of day 1 24-h postdose (red open circle), day 15 predose (blue asterisk), day 22 predose and 24 h postdose of day 22 (green square), and day 43 predose (brown diamond). However, there was a lack of correlation between ELISA and ECL (c) methods for some samples collected on time points, day 22, and all samples collected on day 43
