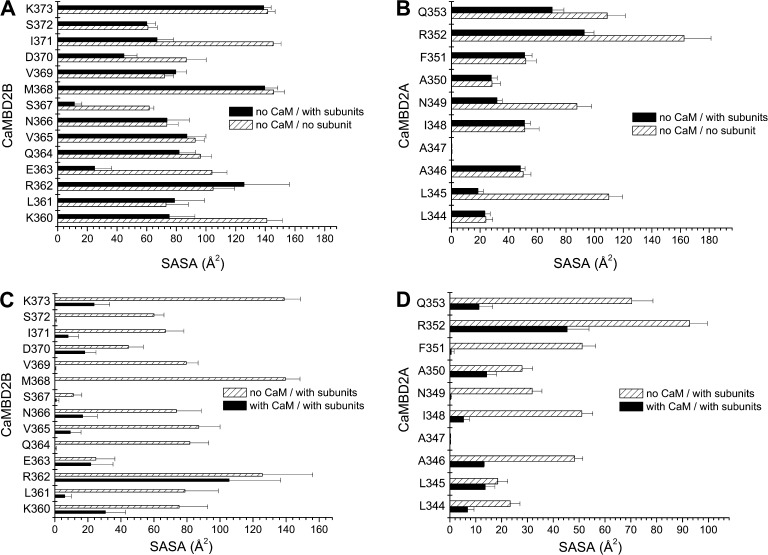
Figure 2.
Structural analysis of the CaM–CaMBD2 interactions. (A and B) SASA was computed for each residue of CaMBD2B (K360-K373) or CaMBD2A (L344-Q353) for either a single KCa3.1 subunit with no CaM (open boxes) or in the presence of a second subunit with no CaM (filled boxes). Calculations were based on the structural model presented in Fig. 1. A strong decrease in SASA was obtained for E363 and S367, indicating an important contribution to the intersubunit interface. Identical calculations performed for residues in CaMBD2A identified L345 and N349 as contributing to the intersubunit interface. (C and D) Variations in SASA caused by the addition of CaM to the KCa3.1 subunit–subunit complex. A strong decrease in SASA caused by CaM was obtained for Q364, M368, V369, and S372 in agreement with those residues lining the CaMBD2B–CaM N-lobe interface. The most important variation was seen with M368, which is projecting inside the CaM N-lobe core. In contrast, SASA computed for R362 and E363 were not significantly affected by the addition of CaM, in accordance with R362 and E363 not contributing to the CaMBD2B–CaM N-lobe interface. Collectively, R362 appeared as the most solvent accessible residue, with no contribution to either the intersubunit or CaMBD2B–CaM N-lobe interfaces. Results obtained for the CaMBD2A support a strong decrease in SASA caused by CaM for I348, N349, and F351, an indication that these residues are located at the CaMBD2A–CaM interface. Residue R352 was found to be highly solvent accessible, with 50% of its surface in contact with CaM.

