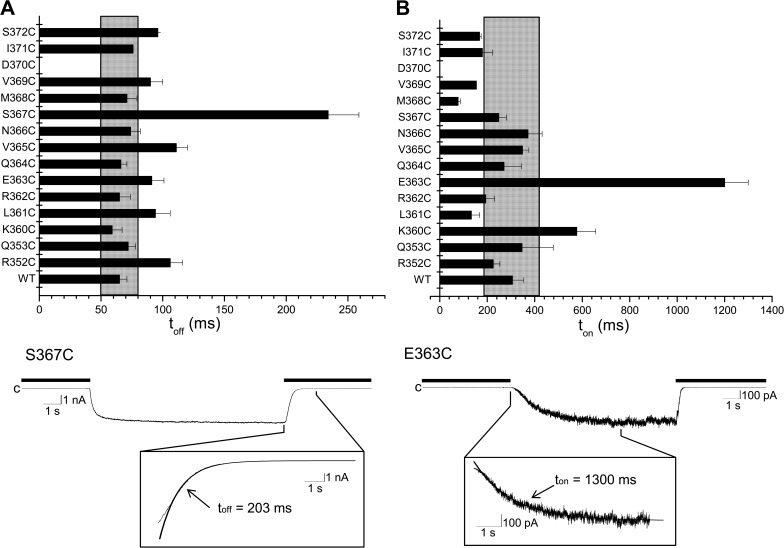
Figure 8.
Effect of mutating residues in the CaMBD2B on channel activation and deactivation times. Horizontal bar graphs summarizing the effect of mutating to Cys residues of CaMBD2B on channel deactivation (toff) (A) and activation (ton) times (B). Values not included in the filled area refer to ton or toff for which P < 0.005 relative to WT (ton or toff [WT] ± 2.5 SD). The mutation D370 did not produce functional channels. (A) Effect on the channel deactivation time toff of substituting to Cys each residue of the CaMBD2B plus residues R352 and Q353 of CaMBD2A. Important variations were seen with S367C (P < 0.0001) and with the mutant channels R352C, L361C, E363C, V365C, and S372C (P < 0.005). (Bottom trace) Inside-out current recording illustrating deactivation of the S367C channel mutant after exchanging a Ca2+-containing solution (25 µM) with a Ca2+-free internal solution (thick line). Deactivation time was obtained by curve fitting to a single exponential the time course of the current decrease initiated by switching to a Ca2+-free internal solution. Measurements were performed in symmetrical K2SO4 conditions at a pipette potential of 60 mV. (B) Effect on the channel activation time ton on substituting to Cys each residue of the CaMBD2B plus residues R352 and Q353 of CaMBD2A. Important variations were seen with E363C (P < 0.0001) and with the mutant channels L361 and M368 (P < 0.005). (Bottom trace) Inside-out current recording illustrating activation of the E363C channel mutant in response to an increase in internal Ca2+ from zero (EGTA; thick line) to 25 µM. Channel activation time was obtained by fitting to a single exponential the time course of the current increase that follows the initial delay observed after adding Ca2+ to the bathing medium.

