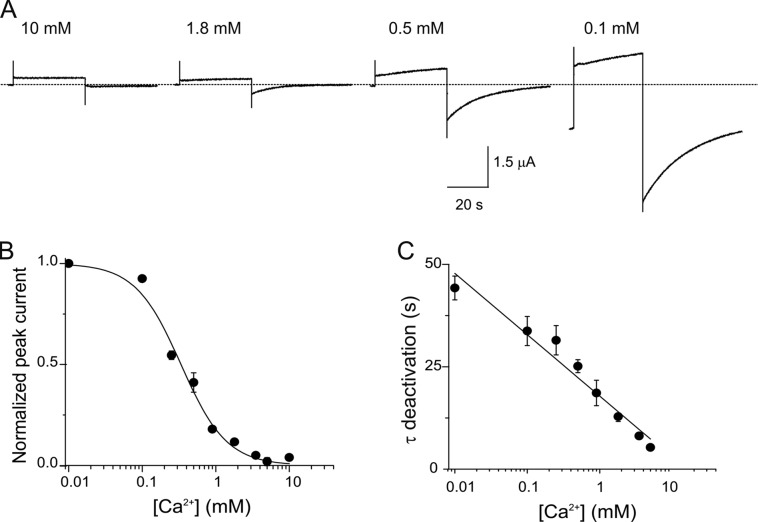
Figure 1.
Ca2+ modulates gating in hCx26 hemichannels. (A) Current traces elicited by a voltage pulse from −80 to 0 mV from oocytes expressing hCx26 hemichannels in the presence of different Ca2+ concentrations. (B) [Ca2+] dose–response relation determined from the peak tail current after a voltage pulse from −80 to 0 mV. The solid line represents the best fits of the data to a Hill equation (Eq. 2). (C) Deactivation time constants as a function of Ca2+ concentration. The solid line corresponds to a linear fit to the data. The data points represent mean ± SEM of at least three independent measurements.

