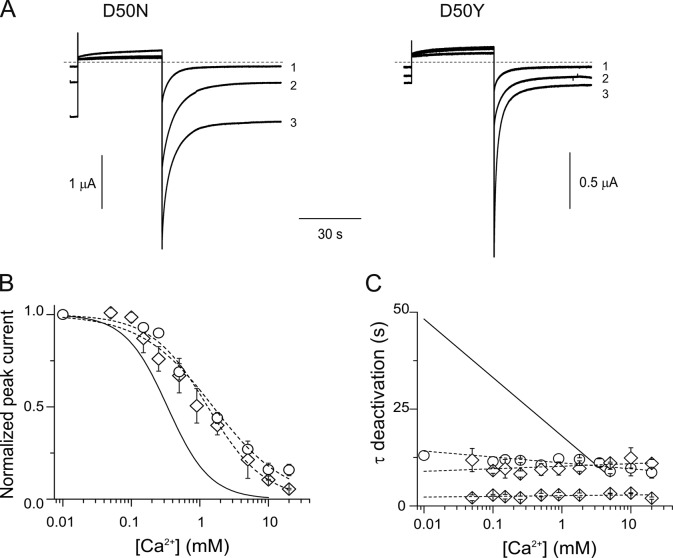
Figure 2.
Gating by Ca2+ is altered by D50N/Y mutations in hCx26 hemichannels. (A) Representative current traces elicited by a pulse to 0 mV from a holding potential of −80 mV for an oocyte expressing D50N or D50Y mutant hemichannels. Numbers 1, 2, and 3 correspond to current traces obtained in the presence of 10, 1.8, or 0.25 mM Ca2+, respectively. (B) Ca2+ dose–response curve for oocytes expressing D50N (open circles) or D50Y mutant (open diamonds) hemichannels. The solid and dotted lines represent the best fits to a Hill equation (Eq. 2) for wild-type (from Fig. 1 B) and D50N/Y mutant hemichannels, respectively. (C) Deactivation time constants of the corresponding tail currents at different Ca2+ concentrations for D50N (open circles) or D50Y mutants (fast and slow time constants are shown as two sets of diamonds). Dotted lines are the best linear fit to the D50N/Y mutant hemichannel data. The solid line corresponds to the linear fit of the average data for wild-type hemichannels (from Fig. 1 C). The data represent mean ± SEM of at least three independent measurements.

