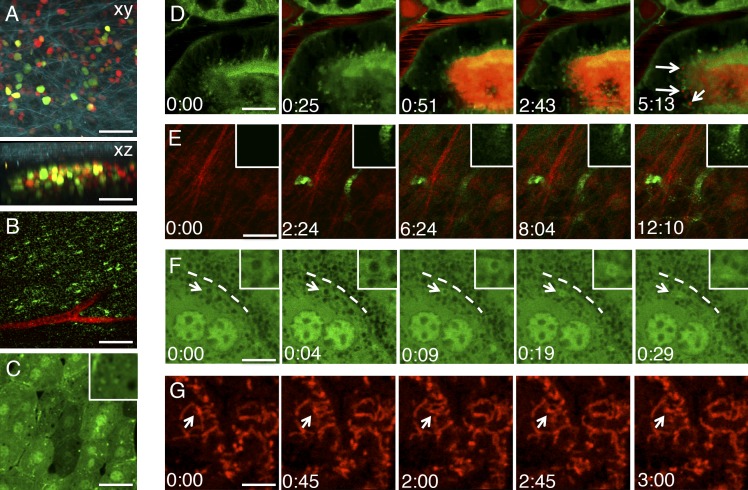
Figure 4.
Imaging subcellular events in live animals. (A) Human squamous carcinoma cells were engineered to stably express the Fucci cell cycle reporter into the nucleus and injected in the back of an immunocompromised mouse. After 1 wk, the tumor was imaged by two-photon microscopy and SHG (excitation wavelength: 930 nm). (top) Maximal projection of a z stack (xy view). Cells in G2/M are in green, cells in G1 are in red, and collagen fibers are in cyan. (bottom) Lateral view (xz) of a z stack. (B) Clusters of GLUT4-containing vesicles (green) in the soleus muscle of a transgenic mouse expressing GFP-GLUT4 and injected with 70 kD Texas red–dextran to visualize the vasculature and imaged by two-photon microscopy (excitation wavelength: 930 nm). (C) Confocal microscopy (excitation wavelength: 488 nm) of hepatocytes in the liver of a transgenic mouse expressing the autophagy marker GFP-LC3. The inset shows small GFP-LC3 autophagic vesicles. (D–G) Dynamics of intracellular compartments imaged by time-lapse two-photon (E) or confocal microscopy (D, F, and G). (D) Endocytosis of systemically injected 10 kD Texas red–dextran into the kidney of a transgenic mouse expressing the membrane marker m-GFP. The dextran (red) is transported from the microvasculature into the proximal tubuli, and then internalized in small endocytic vesicles (arrows; Video 2). (E) Endocytosis of a systemically injected 10 kD of Alexa Fluor 488 dextran into the salivary glands of a live rat. The dextran (green) diffuses from the vasculature into the stroma, and it is internalized by stromal cells (insets). Collagen fibers (red) are highlighted by SHG. (F) Regulated exocytosis of large secretory granules in the salivary glands of a live transgenic mouse expressing cytoplasmic GFP. The GFP is excluded from the secretory granules and accumulates on their limiting membranes (arrows) after fusion with the plasma membrane (broken lines). The gradual collapse of an individual granule is highlighted in the insets. (G) Dynamics of mitochondria labeled with the membrane potential dye TMRM in the salivary glands of a live mouse. Time is expressed as minutes:seconds. Bars: (A) 40 µm; (B) 15 µm; (C, D, E, and G) 10 µm; (F) 5 µm.

