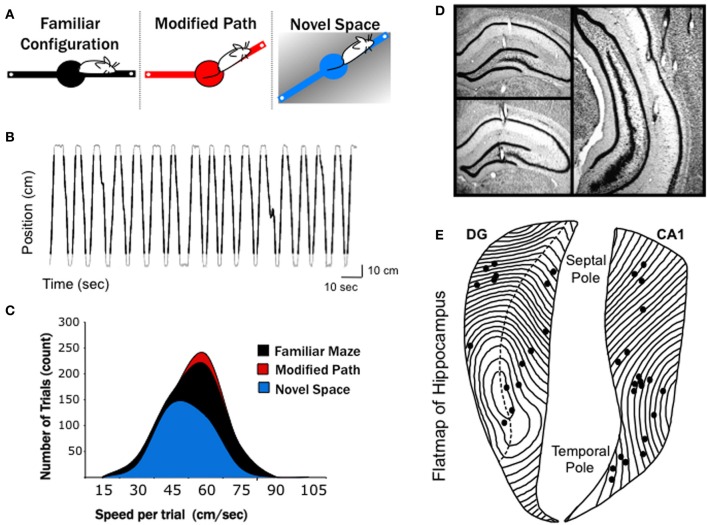
Figure 1.
Experimental conditions and electrode positions. (A) A series of three, 10-min recordings were obtained from each rat over a 4 days period in: (1) in familiar space, (2) along a modified path in familiar space, and (3) in novel space. The black (familiar), red (modified), and blue (novel) color codes are maintained in all figures to differentiate conditions. The familiar maze configuration consisted of a finely textured linear track placed in a generally white room. On the following day the rats where placed on a modified path in the same room, with one arm altered 30°. Two days later (following 1 day of retraining on the familiar configuration) the rats were run on a coarsely textured linear track in a novel space. (B) The position of a rat along the 140-cm linear track over time during 33 consecutive trials is shown. Black lines overlaid on the gray trace indicate the portion of each track traversal that was considered as an individual trial. A threshold 14 cm from either end of the linear track was used to eliminated data at the ends of the runway (see Methods). (C) Distribution of mean trial speeds for each recording condition across all animals, with the average speed of trial in the novel space significantly slower than both the familiar maze and modified path conditions. Note fewer total running trials were used for the novel condition due to slower running speeds and longer pauses at the end of each arm during the 10-min recording (see Results). (D) Photomicrographs of representative recording sites in septal dentate gyrus, septal CA1, and mid-septotemporal CA1. (E) Flatmap representation of the hippocampal formation with all recording locations indicated by dots. The septal pole of the hippocampus is located at top and the temporal pole at bottom.

