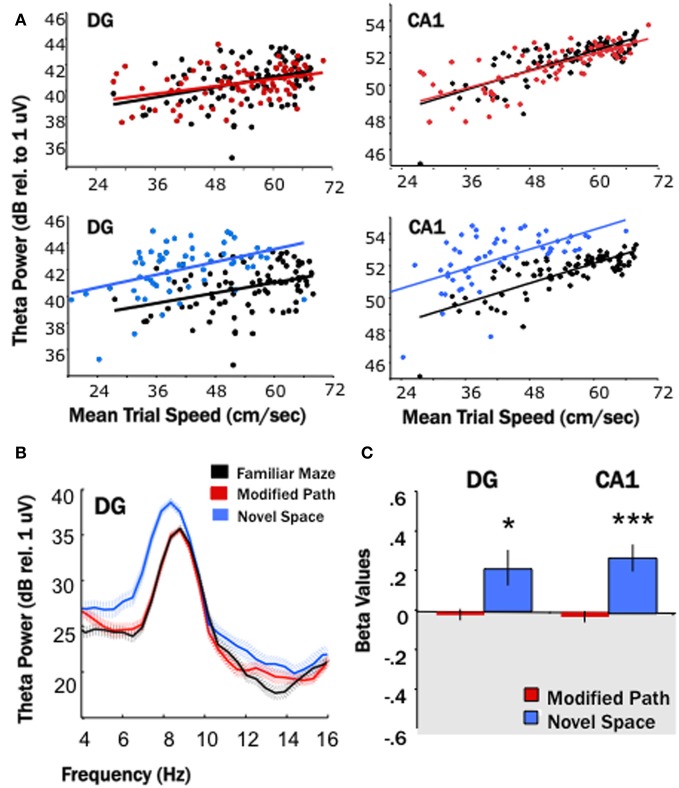
Figure 2.
Locomotion in a novel spatial environment increases theta power. Theta power is higher for the novel condition (blue) than for the familiar condition (black) in both the DG and CA1. (A) Baseline theta power values (6–10 Hz) in CA1 and the DG as a function of the average trial speed for a single animal in the familiar condition (black), on the modified path (red), and in the novel space (blue). The distribution of speeds overlapped during the familiar and modified path conditions however the average trial speed tended to be lower while the rat locomoted through a novel space. Note the distribution of trial speeds in the novel space (blue) in both the DG and CA1 as compared to the distribution of trial speeds in the familiar condition (black). (B) Averaged power spectral density for a single animal across all trials during the familiar maze condition (black), on the modified path (red), and in a novel space (blue) in the DG. The hatched areas indicate the standard error of the mean across trials. Note the increase in average theta power and apparent decrease in theta frequency at the single DG site when not controlled for speed. (C) The standardized regression coefficient (β-value, calculated for each channel from the area of theta power and average speed of each data segment using linear regression analysis) comparing changes in the modified path (red) and novel space (blue) from the familiar condition independent of speed. There was a significant increase in theta power at DG and CA1 sites independent of changes in locomotor speed in a novel spatial environment (*p < 0.05, ***p < 0.001).

