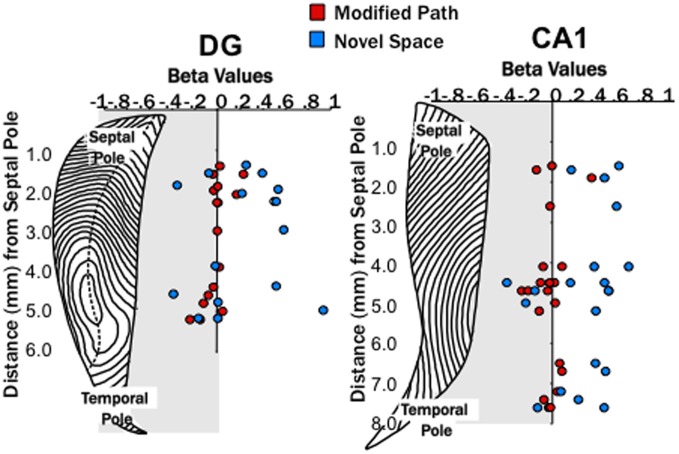
Figure 3.
Theta power increased at DG and CA1 sites across the entire septotemporal axis. Distribution of β-values (calculated for each channel from the area of theta power and average speed of each data segment using linear regression analysis) from individual electrode sites within the DG (left) and CA1 (right) at different septo-temporal positions. Points indicate changes in the power of theta power (6–10 Hz) on the modified path (red) and novel space (blue) from the familiar condition when controlled for speed. Note the increases in theta power were similar at sites all along the septotemporal axis with no obvious differences in magnitude.

