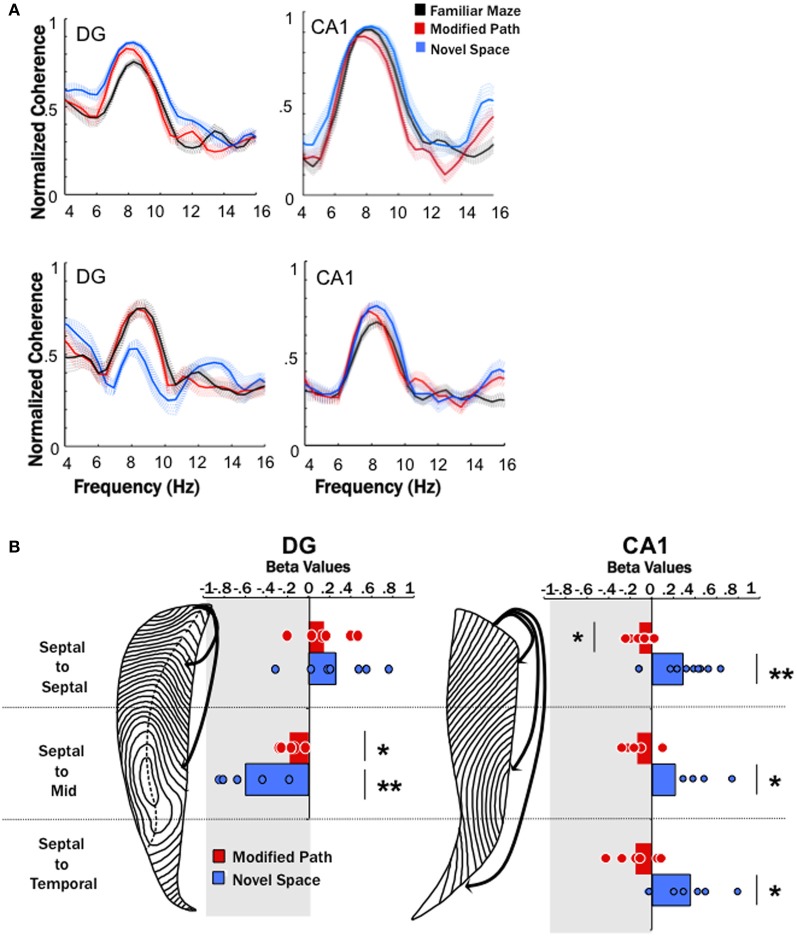
Figure 4.
Theta coherence decreases across the long axis of the dentate (DG) and increases across the long axis of CA1. (A) Averaged coherence for a pair of electrodes within one animal across all data segments (trials) during the familiar maze condition (black), on the modified path (red), and in a novel space (blue) in the DG and CA1. The hatched areas indicate the standard error of the mean across trials. The top row illustrates an increase in coherence between two septal dentate sites (left) and two septal CA1 electrode sites during navigation in novel (blue) space. The bottom row illustrates a decrease in coherence between a septal and a mid-septotemporal dentate electrodes sites (left) and an increase in coherence between a septal and mid-septotemporal CA1 electrode sites (right) during navigation in novel (blue) space. Note that the raw coherence plots are not correct by speed (which is the purpose of the regression analyses). (B) The standardized regression coefficient (β-values) for coherence across all electrode pairs within septal, across septal, and mid-septotemporal sites and across septal and temporal sites comparing changes in the modified path (red) and novel space (blue) from the familiar condition independent of speed for DG pairs (right column) and CA1 pairs (left column). Note no significant changes were observed between mid-septotemporal-midseptotemoral pairs (data not shown) within the DG. In contrast significant increases were observed among mid-septotemporal-mid-septotemporal and temporal-temporal pairs in CA1(data not shown) (*p < 0.05, **p < 0.01).

