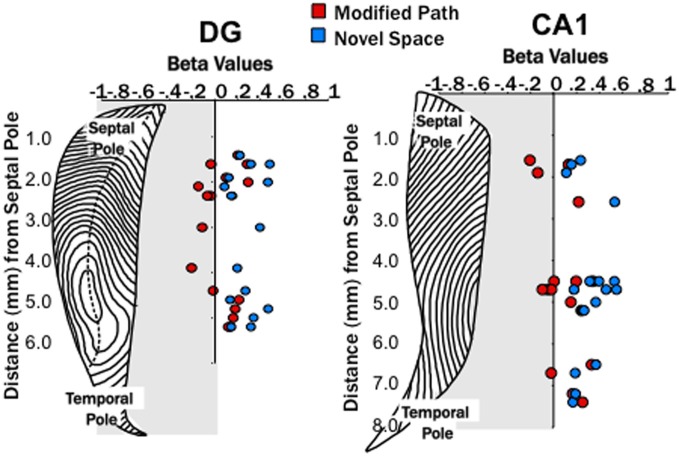
Figure 6.
Locomotion in a novel spaces increases fast gamma power across both the dentate and CA1. Distribution of β-values for fast gamma power and average speed of each trial (using linear regression analysis) across the septo-temporal axis of the DG and CA1. Points indicate changes in the power of fast gamma power (65–100 Hz) on the modified path (red) and novel space (blue) from the familiar condition when controlled for speed. Changes in gamma power at DG and CA1 sites did not differ significantly along the septo-temporal axis.

