
Figure 1.
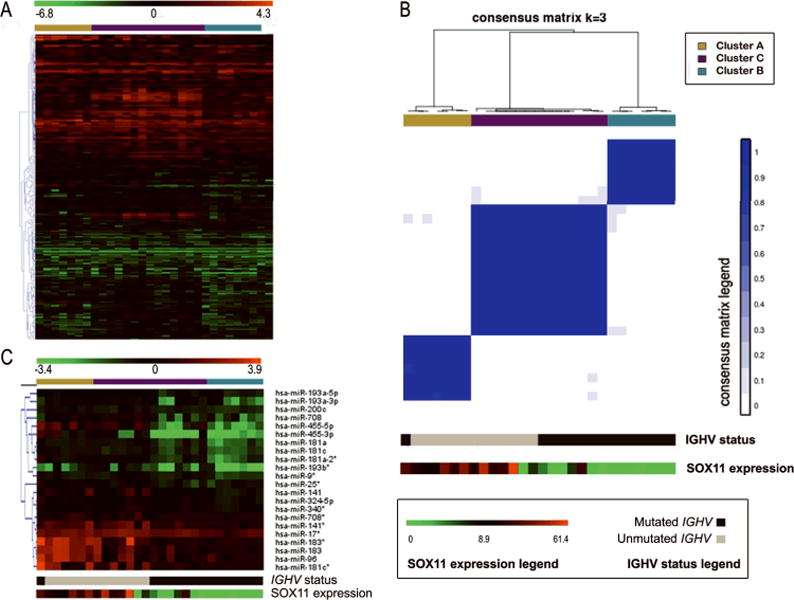
(A) Heat map of the normalized expression values of the 286 miRs showing gene expression variation > 50th percentile of the variation degree among the leukemic MCL samples. Sample order is the same in all panels, as obtained from the consensus clustering analysis, and here also including at the extreme right side the expression values of the two samples excluded from the core clusters. miRs are clustered using a Pearson algorithm. (B) Consensus matrix plot showing the three robust core clusters generated at k = 3 from the miR expression profiling data obtained by qRT-PCR, together with IGHV mutational status and SOX11 expression data. (C) Heat map of the normalized miR expression values of the significant miRs found in the supervised analyses considering either IGHV status as SOX11 expression categories along the MCL series defining the core clusters.