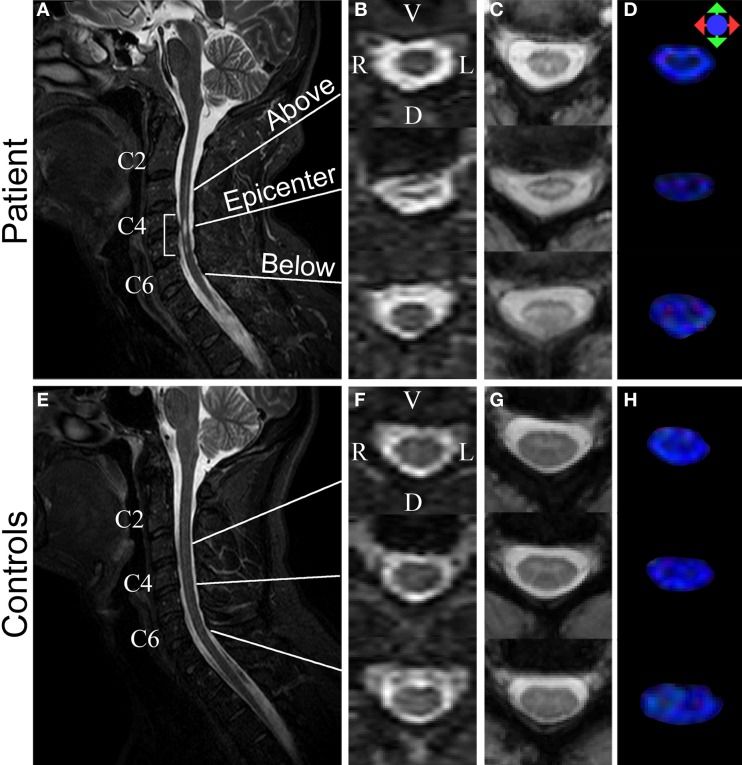
Figure 2.
Structural MR images acquired from the patient (top row) and a control (bottom row). (A,E) Sagittal T2-w images. Bracket in (A) highlights injury epicenter of the patient. (B,F) Axial T2-w images. (C,G) Axial MTCSF images. (D,H) Axial FA color maps. The FA maps are color-coded using a standard diffusion color-encoding scheme (r/l: red, a/p: green, s/i: blue). Each row of (B–D) shows a section from: (1) above the injury epicenter, (2) injury epicenter, and (3) below the injury epicenter. Images from the corresponding cervical levels in the control are shown in each row of (F–H).

