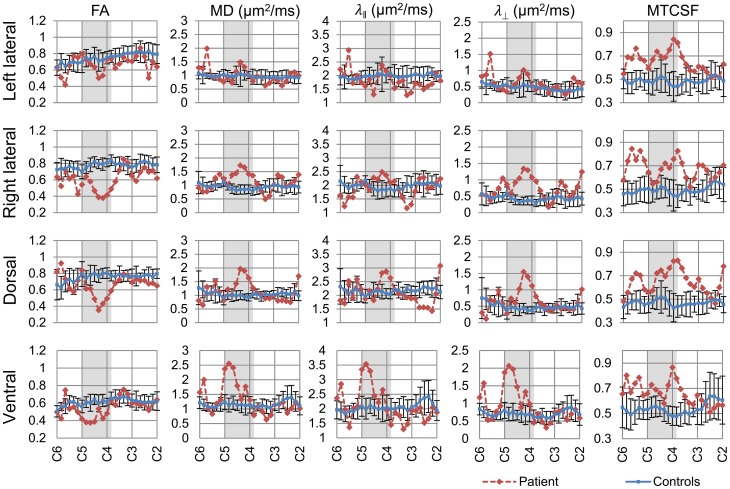
Figure 4.
Column-specific data comparison of DTI- and MTI-derived quantities of the controls (blue line) and the patient (red line). FA, MD, λǁ, and λ⊥, and MTCSF values of each spinal column were measured between C2–C6. The resulting column profiles are shown. Darker area within the plots indicates the patient's injury epicenter. Values reported for the controls are mean ± SD. FA value decreased, while MD, λǁ, and λ⊥ increased at the injury epicenter. MTCSF value increased throughout the cervical cord.

