Figure 6.
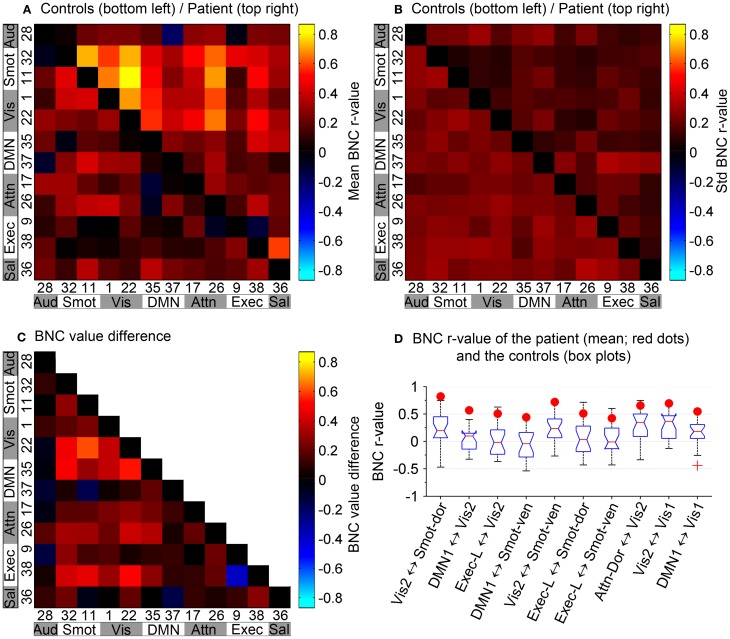
Between-network connectivity. (A) BNC correlation matrix shows synchrony between pairs of functional networks. (B) Combined matrix of the standard deviation of the corresponding BNC measurements. (A,B) In reference to the top–left to bottom–right diagonal axis, bottom–left portion corresponds to the controls and top–right portion corresponds to the patient. Diagonal elements have been zeroed for display purposes. (C) Difference between the controls and the patient's BNC measurements. (D) Box plots of controls' BNC measurements, with the patient's mean BNC values indicated by red dots. Shown are the 10 functional networks with the largest differences between the patient and controls.

