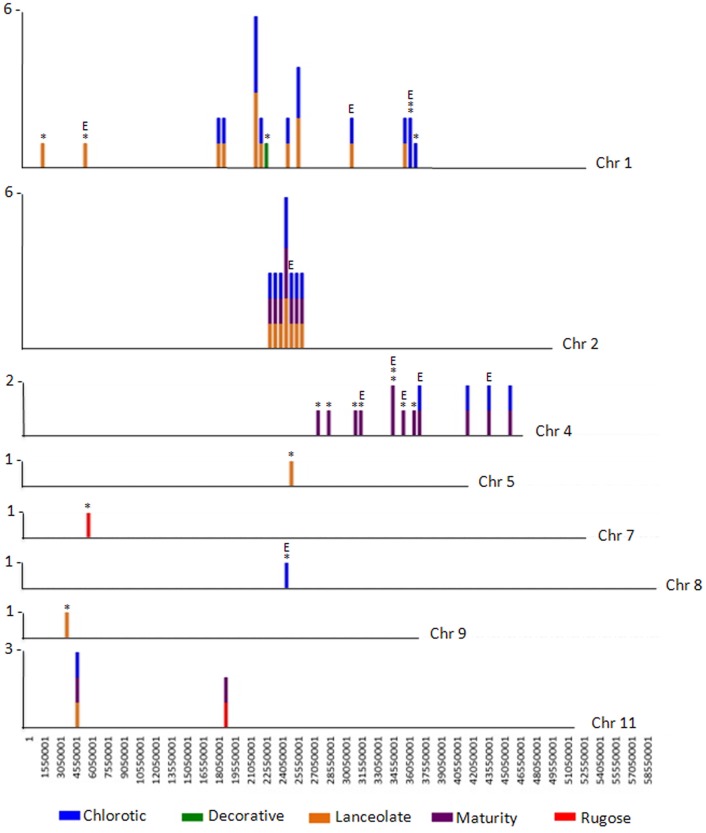
Figure 3.
CREST analyses identifies SV belonging to Class 2 and Class 3. The number of large genomic deletions in each class identified per 500,000 bp on each chromosome of P. vulgaris were counted and plotted as a vertical line. The height of the line indicates the number of SV per 500,000 bp region that were identified. The largest number of SV per chromosomal region is noted to the left of each chromosome. The mutant containing the deletion is represented by color: blue, chlorotic; purple, maturity; green, decorative; red, rugose; orange, lanceolate. Deletions belonging to Class 3 are likely a result of FN mutagenesis and are highlighted by an asterisk (*). Deletions potentially impacting gene expression are highlighted with an E. Note the region of natural variation (SV Class 2) shared by three mutant plants on chromosome 2.

