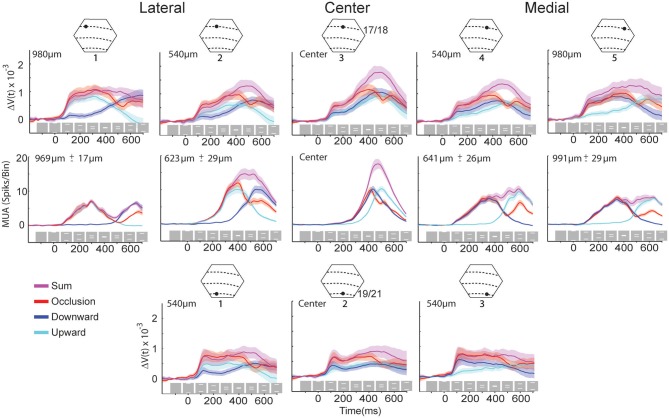
Figure 3.
The ΔV(t) and MUA at selected spots in the cortex and the sum of the ΔV(t) and MUA from the single bar conditions. Above each column is a cartoon of the area imaged by the hexagonal photodiode array where dashed lines indicate the average area borders (see Materials and Methods) and black dots indicate the approximate position of the recording site. The distance from the site representing the center of field of view appears at the top left of each graph. The gray boxes with white bars indicate the position of the stimulus on the monitor for the different time points for the occlusion condition only. Solid lines indicate the mean and shaded regions indicate the standard error of mean, for each trace. For the ΔV(t) N = 14 animals at each site and the MUA represents the average activity across all 16 leads of the laminar probe for N = 10 animals at each location.

