
Figure 6.
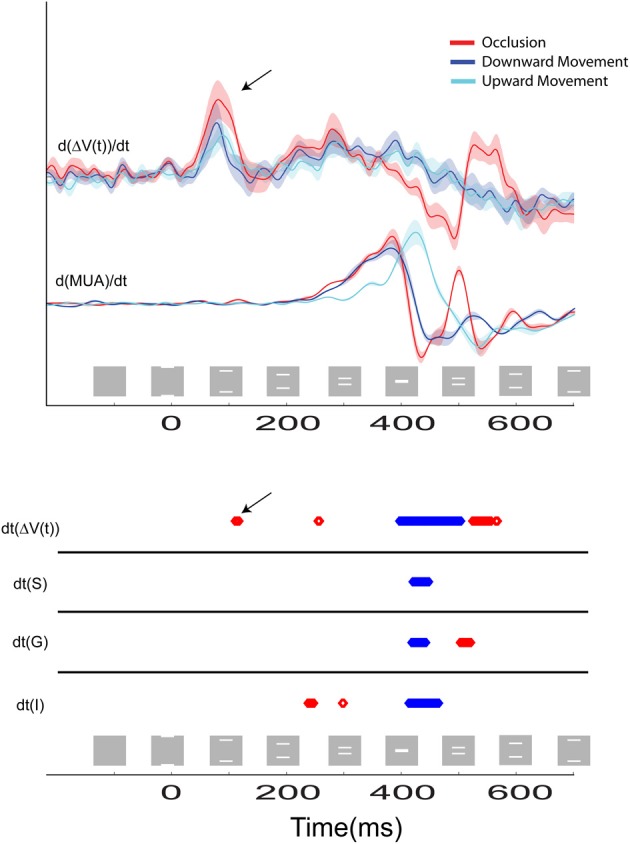
The time course of the temporal derivatives for the three stimulus conditions are shown. Top: the d[ΔV(t)]/dt and the d(MUA)/dt. Bold lines indicate the mean values for N = 14 and N = 10 animals, respectively, and the shaded regions indicate standard error of mean (SEM). Recordings were taken from the cortical site representing the center of field of view at the 17/18 border. The first positive peak at 85 ms is due to the directional pre-excitation ahead of the moving bar representation. Bottom: Statistical comparison of the amplitude of the response for the occlusion condition compared to the amplitude of the response for the single bar conditions for the d[ΔV(t)]/dt and the d(MUA)/dt recorded from supragranular (S), granular (G), and infragranular (I) cortical layers at the site representing the center of field of view. Epochs where the amplitude of these variables during the occlusion condition is significantly greater than the amplitude of the variables to either of the two single bar conditions are shown in red, and epochs where the amplitude of the variables to the occlusion condition is significantly less than the amplitude of responding to either of the single bar conditions are shown in blue (p < 0.01). Note that when the first effect of the excitatory synaptic activity reaches the area 17/18 border at 120 ms, the dΔV(t)/dt becomes statistically significantly stronger than in the single bar conditions (black arrows Top and Bottom).