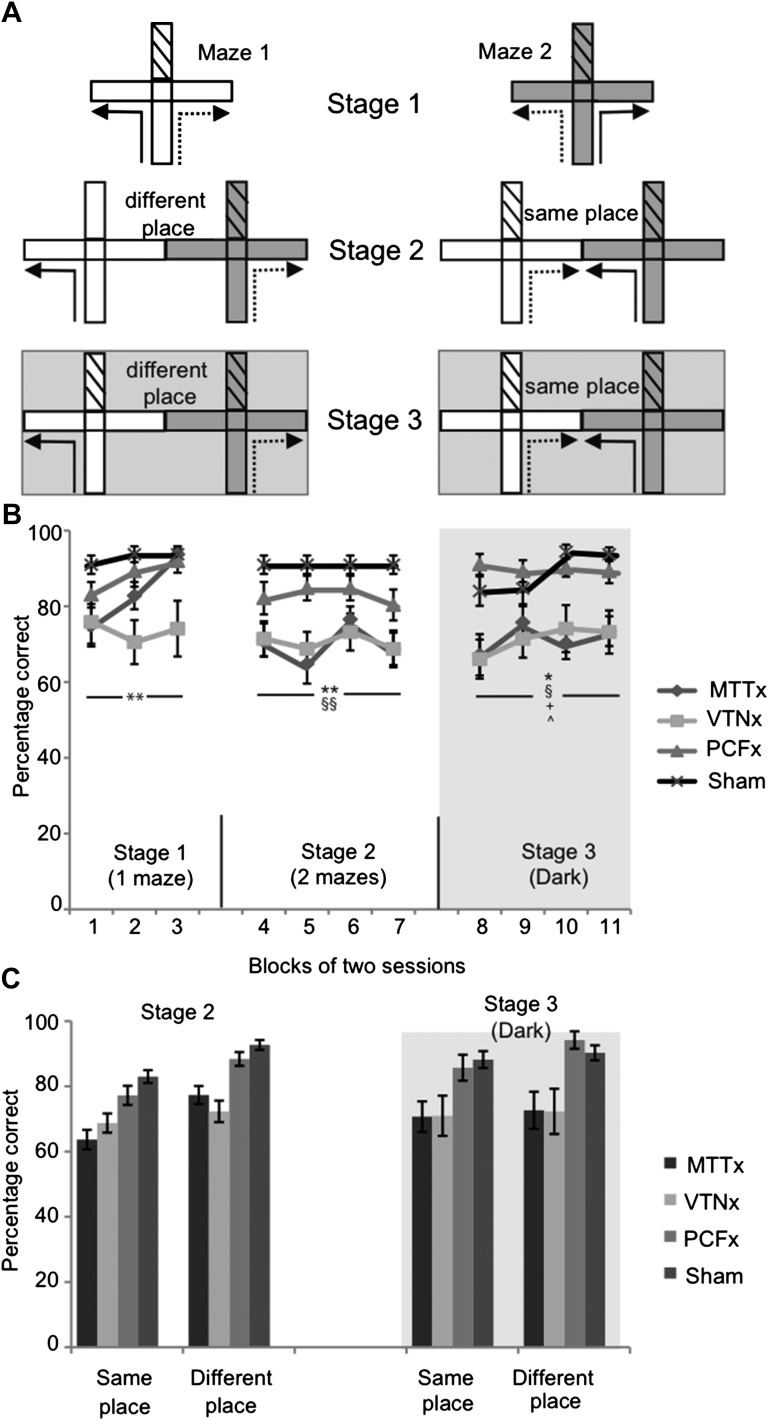
Figure 2. T-maze alternation.
(A). Experimental design for the three stages: solid lines indicate the forced sample phase while dashed lines indicate the correct response in the choice phase. By placing a barrier at the entrance of the arm access to an arm could be blocked (effectively turning the cross-maze into a T-maze configuration; this is illustrated by hatching). Initial training on the task (Stage 1) permitted the use of multiple strategies supporting alternation, that is allocentric, intra-maze, idiothetic, direction alternation (with reference to a known bearing). The task was then systematically modified in order to prevent the use of intra-maze cues (Stage 2) or the use of intra-maze and distal allocentric cues (Stage 3). These manipulations included using two mazes instead of one (Stage 2 and 3) or running in the dark, as illustrated with the gray background (Stage 3); (B) Mean percentage of correct choices (±SEM) for all three stages; (C) percentage of correct choices for the ‘same place’ and ‘different place’ trials in Stages 2 and 3. The vertical lines depict the standard error of the mean. Abbreviations: p; Sham, surgical control; *Significant difference between VTNx and Sham group (p<0.05); **Significant difference between VTNx and Sham group (p<0.01); §Significant difference between MTTx and Sham group (p<0.05); §§Significant difference between MTTx and Sham group (p<0.01); +Significant difference between PCFx and MTTx (p<0.05); ^Significant difference between PCFx and VTNx (p<0.05).

