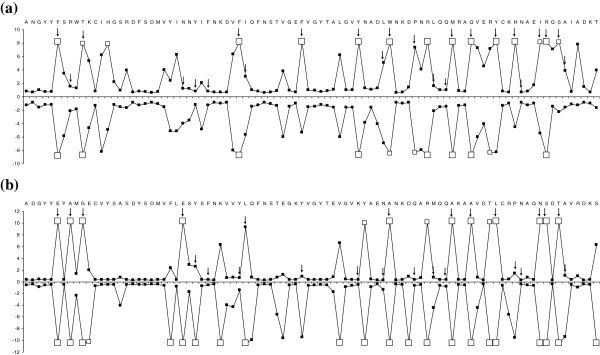
Figure 1.

Approximate posterior means of ω, calculated as the weighted average of ω over the 11 site classes, weighted by the posterior probabilities under the random sites model M8 (β and ω) are shown for DAB1-like sequence variants (a) and for DAB3-like sequence variants (b). The values for sexual diploids are shown above the x-axis and those for gynogenetic diploids are shown below the x-axis. Sites inferred to be under positive selection at the 99% level are indicated by large white squares and those at the 95% level are indicated by medium white squares. Arrows (showed only above x-axis) indicate the positions of human antigen binding sites (HLA-DRB1 gene) [35]. The reference sequences used in the graphic presentation are the following: Cagi-DAB1*05 for DAB1-like sequence variants and Cagi-DAB3*05 for DAB3-like sequence variants.
