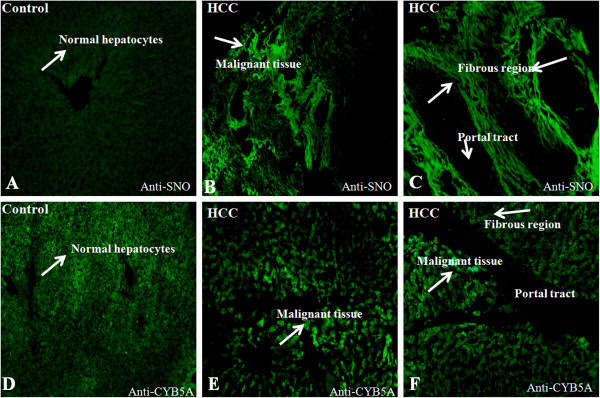
Figure 5.
Evidence of S-nitrosylation in HCC: Increased S-nitrosylation is evident in the fibrous portion and tumor cells in HCC. Anti SNO-Cys antibody was used to reveal the distribution of S-nitrosylation signals in the HCC and controls. Significant increase CYB5A is also evident in both fibrous and tumor cells similar to S-nitrosylation. Figure A &D represents control liver on the other side B, C, E, F explained strong S- nitrosylation signals in HCC.

