
Fig. 4.
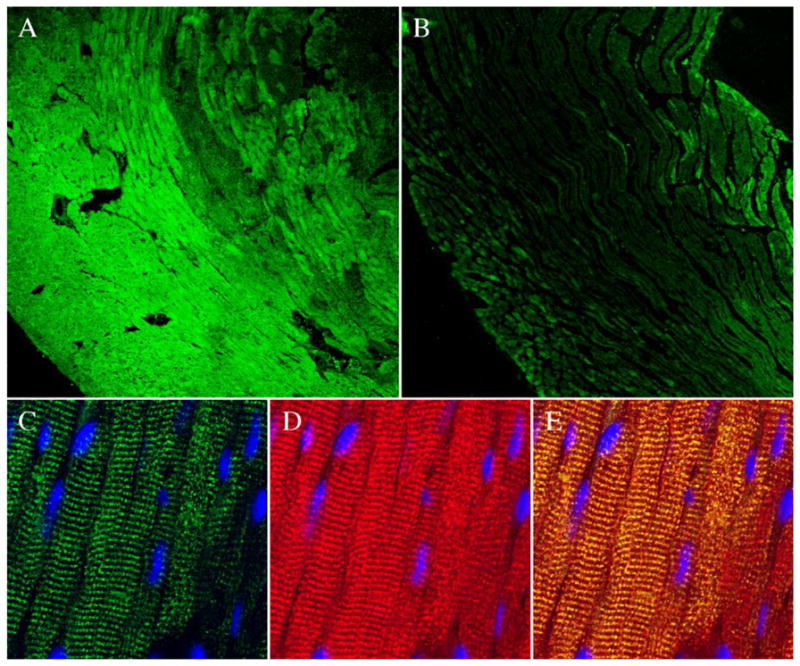
Immunolocalization of myocardial IL-6. Representative lower magnification images (100×, panels A and B) demonstrate increased expression of IL-6 in the ischemic/reperfused myocardium. Minimal IL-6 immunoreactivity (green fluorescence) was noted in the sham-operated hearts (panel B). In contrast, extensive IL-6 expression was noted in the ischemic/reperfused zone in the hearts of preconditioned mice 30 min after the preconditioning ischemia (panel A). Higher magnification images (630 ×, panels C–E) demonstrate the cytoplasmic distribution of IL-6 (panel C, green fluorescence) in cardiomyocytes. Cardiomyocytes are identified by the red fluorescence of troponin T (panel D). Colocalization of IL-6 and troponin T in yellow fluorescence (panel E) confirms the cytoplasmic distribution of intracellular IL-6 in cardiomyocytes. Nuclei are identified by DAPI (panel E, blue fluorescence).