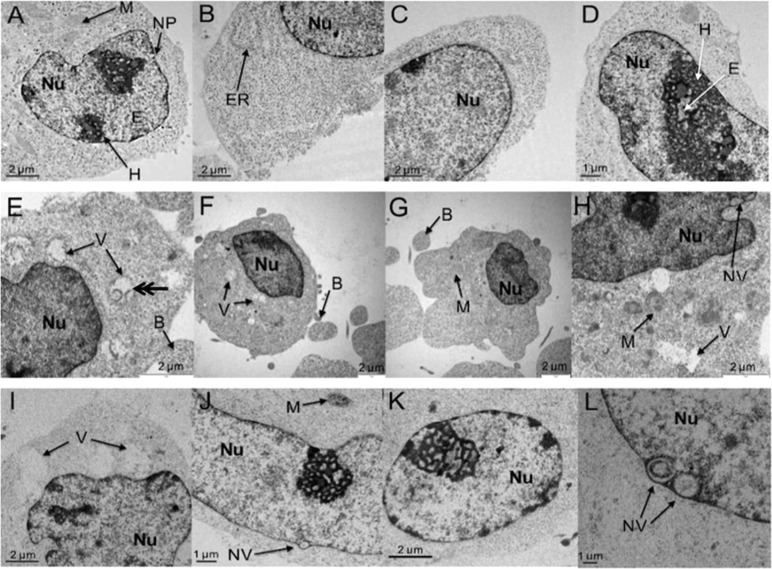
Figure 4.
Detection of apoptosis in A2780 ovarian cancer cells after treatment with 1. (A–D) Control cells showing typical heterochromatin (H) and euchromatin (E) distributions, mitochondria (M), nuclear pores (NP), and rough endoplasmic reticulum (ER). (E–H) Cells exposed to 1 μM 1 for 24 h, showing swollen mitochondria (V), nuclear vacuoles (NV), and membrane blebbing (B). (I–L) Cells exposed to 5 μM 1 for 24 h, showing abnormal chromatin distributions and further vacuole formations.

