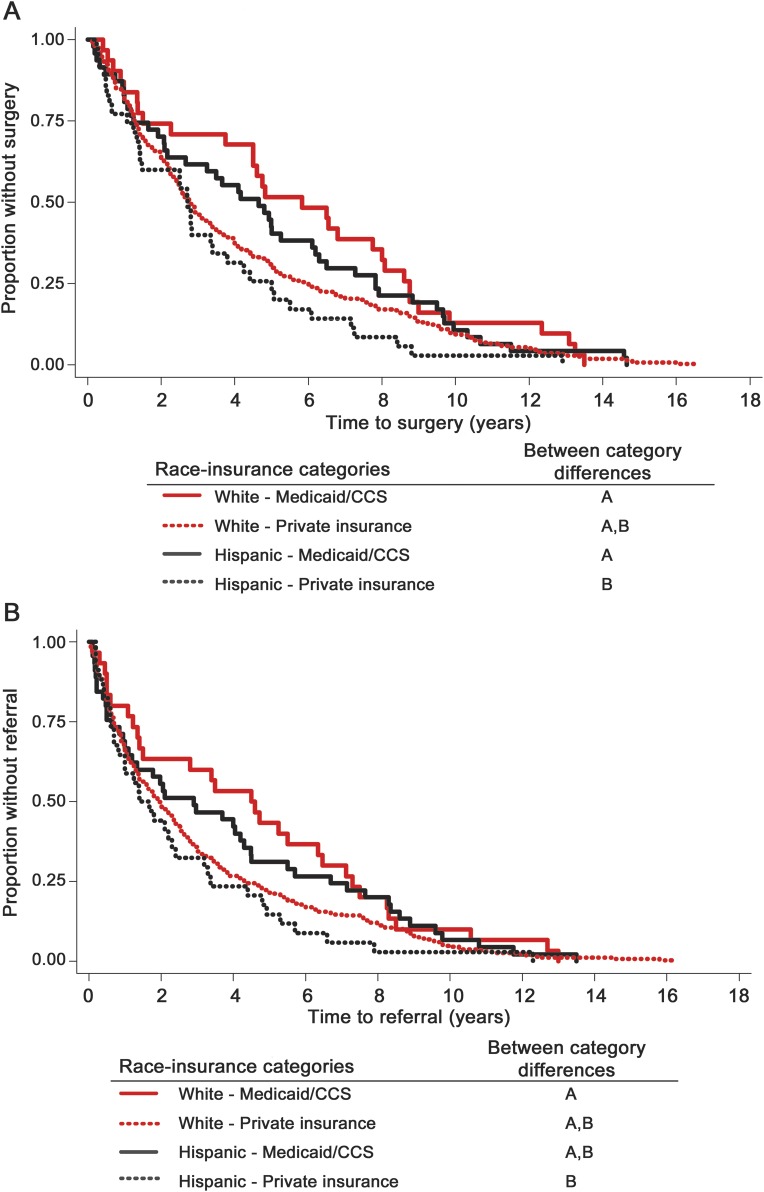
Figure 1. Kaplan-Meier analysis for (A) time to surgery and (B) time to referral by race and insurance.
Race-insurance categories with different letters are significantly different from one another using Cox proportional hazards test. Log-rank test across all 4 categories for (A) time to surgery (p = 0.049) and (B) time to referral (p = 0.097); n = 389 based on total sample N = 430 minus missing data (n = 12; race/ethnicity, n = 2; and insurance type, n = 10) and those of other race/ethnicity (n = 29). CCS = California Children's Services.

