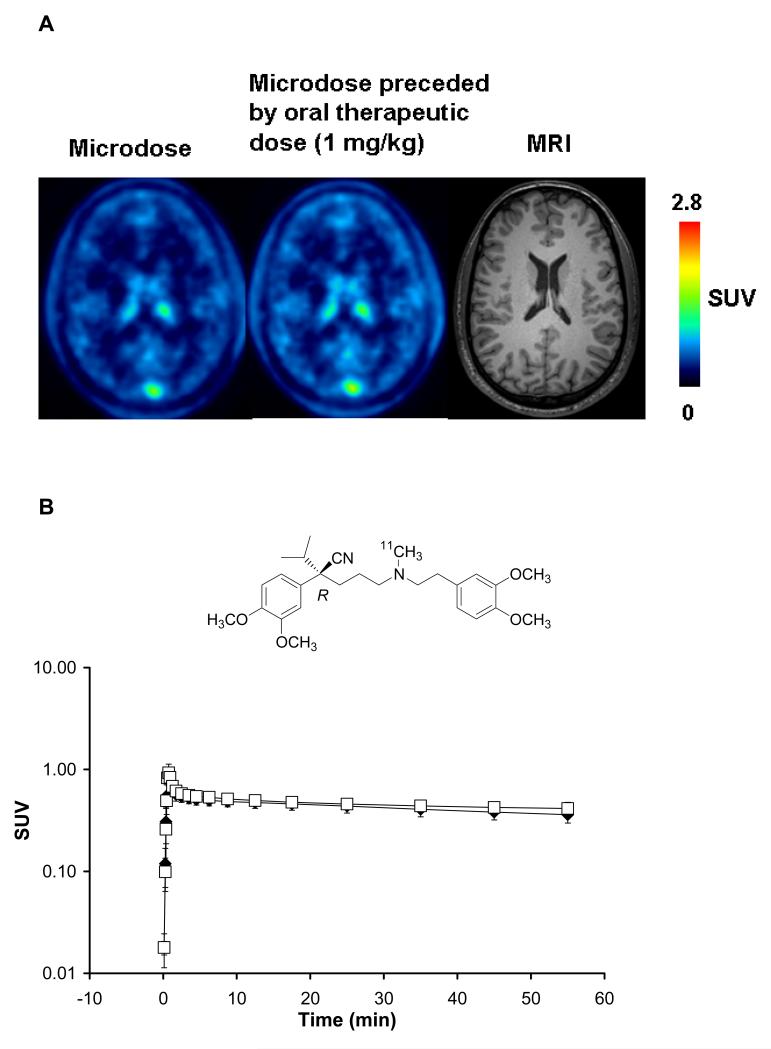
Figure 3.
(A) Transaxial PET summation images depicting radioactivity distribution in brain in one subject after administration of an iv microdose of (R)-[11C]verapamil (left image) and an iv microdose preceded by an oral therapeutic dose (1 mg/kg) of verapamil given 1 h before radiotracer injection (middle image). The right image shows the subject’s brain magnet resonance image (MRI). The radiation scale is set from 0 to 2.8 standardized uptake value (SUV). PET images were recorded on an Advance PET scanner (General Electrics Medical Systems). (B) Time-activity curves (mean SUV±SD) of (R)-[11C]verapamil in whole brain grey matter after administration of an iv microdose (open squares) and an iv microdose preceded by an oral therapeutic dose (1 mg/kg) of racemic verapamil given 1 h before radiotracer injection (filled diamonds) in 6 healthy volunteers. The chemical structure of (R)-[11C]verapamil is shown on top of the graph.

