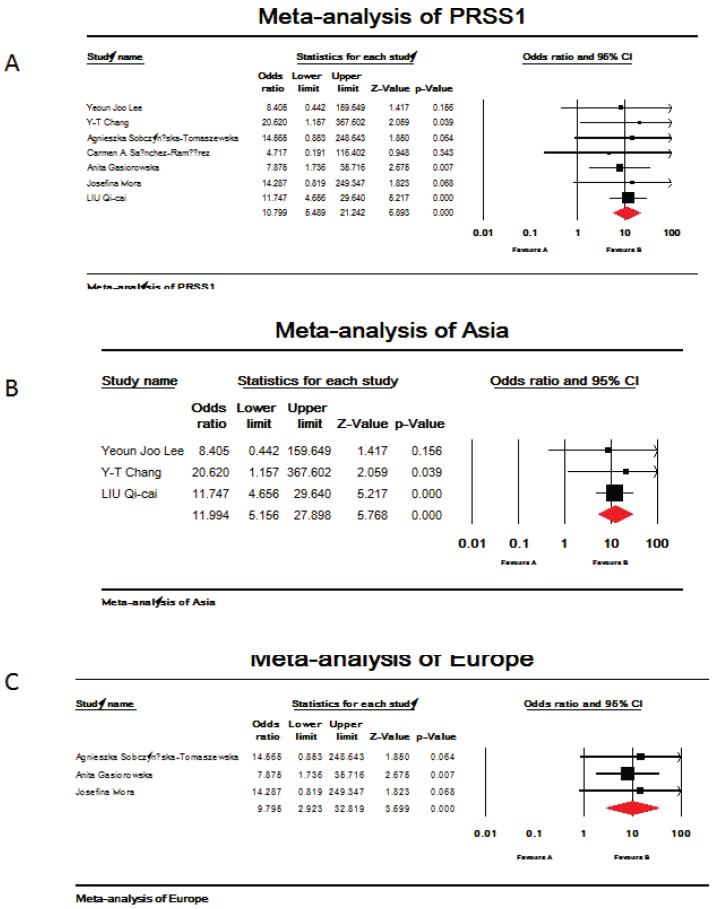
Figure 1.
Meta-analysis of mutations in PRSS1 gene and total pancreatitis. (A,B,C). A. Analysis of PRSS1 gene and total pancreatitis. The overall OR is shown. The OR of each study is marked with a black square. The overall OR is indicated by red diamond. B. Asia subgroup analysis of PRSS1 gene and total pancreatitis. The overall OR is shown. The OR of each study is marked with a black square. The overall OR is indicated by red diamond. C. Europe subgroup analysis of PRSS1 gene and total pancreatitis. The overall OR is shown. The OR of each study is marked with a black square. The overall OR is indicated by red diamond.

