
Figure 4.
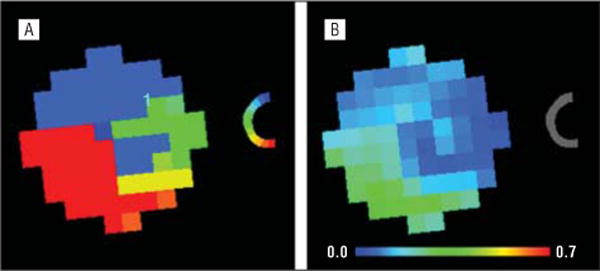
Retinal ganglion cell–axonal complex connectivity maps for the cell body segment (in the ganglion cell layer) to the optic nerve head neural rim segment. Shown are color-coded correspondence (A) and highest r2 value (B) maps.
Official websites use .gov
A
.gov website belongs to an official
government organization in the United States.
Secure .gov websites use HTTPS
A lock (
) or https:// means you've safely
connected to the .gov website. Share sensitive
information only on official, secure websites.
Retinal ganglion cell–axonal complex connectivity maps for the cell body segment (in the ganglion cell layer) to the optic nerve head neural rim segment. Shown are color-coded correspondence (A) and highest r2 value (B) maps.