Figure 5.

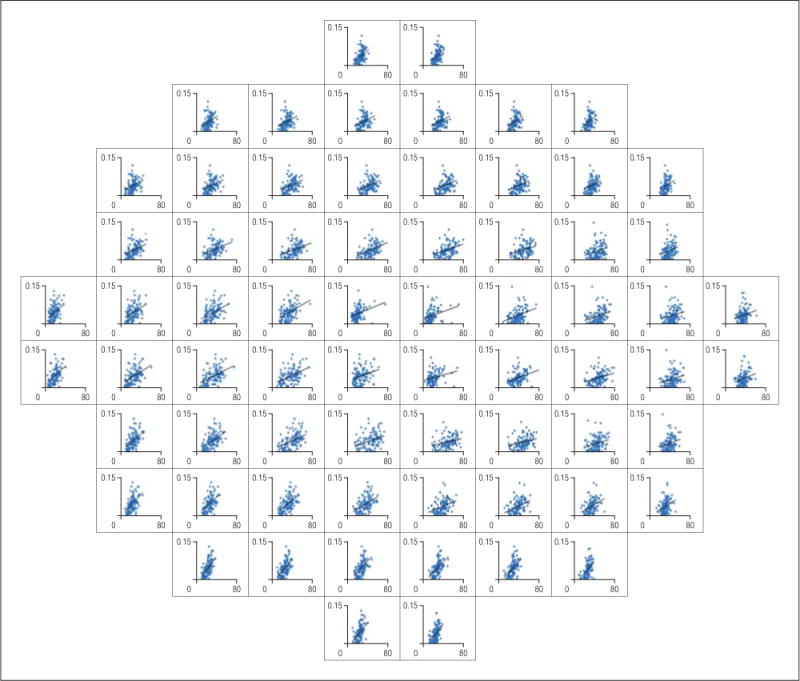
Scatterplots for the highest r2 values between the regional mean macular ganglion cell layer thickness (x-axis, 0–80 μm) and the regional optic nerve head rim area (y-axis, 0–0.15 mm2).

Scatterplots for the highest r2 values between the regional mean macular ganglion cell layer thickness (x-axis, 0–80 μm) and the regional optic nerve head rim area (y-axis, 0–0.15 mm2).