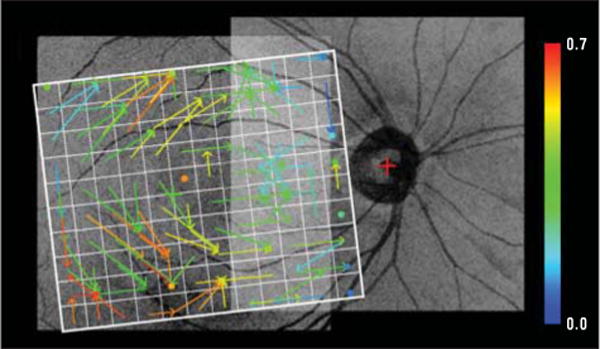
Figure 7.

Connectivity map from the macular regions to the initial nerve fiber bundle regions as in Figure 6A but based on left eye spectral-domain optical coherence tomography data only. The overall pattern of connections is similar to that shown in Figure 6A, but the connectivity is more noisy based on half the data as in Figure 6A. Similar results were obtained for the left eye only that corresponded to the other panels in Figure 6.
