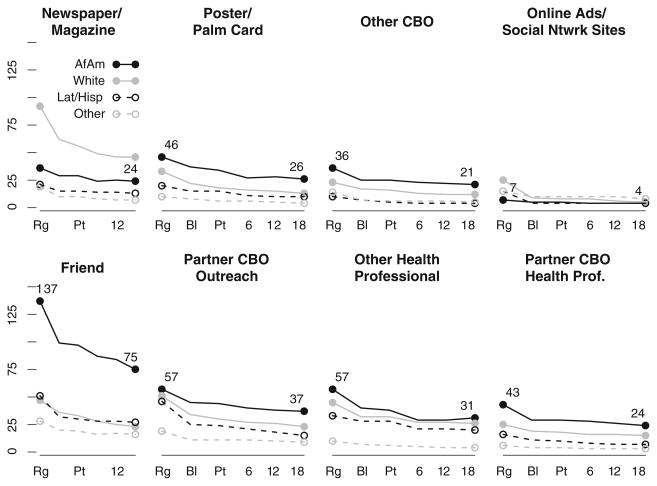
Fig. 4.
Number of participants active in the study at each observation point plotted by recruitment method and race/ethnicity. Dark solid lines are African American, light solid lines are white, dark dashed lines are Hispanic/Latino, and light dashed lines are men of other/ mixed race/ethnicity. Top row shows advertising-based recruitment methods and the bottom row shows in-person recruitment methods. Rg = registration, Bl = baseline, Pt = immediate post-intervention, 6= 6 months, 12=12 months, 18=18 months

