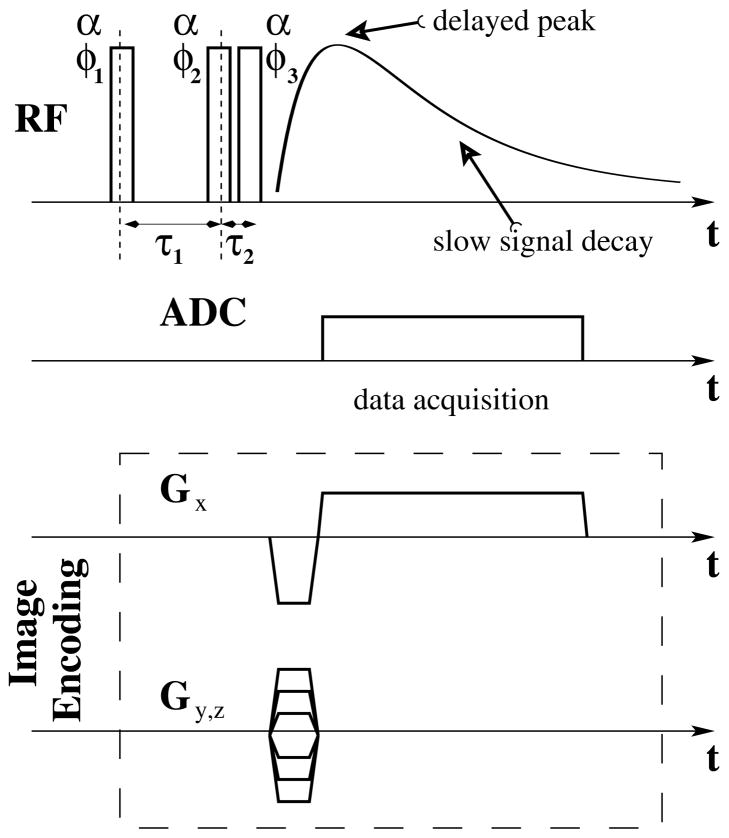
Figure 1.
Schematic diagram of the triple–quantum–filter (TQF) imaging sequence, including TQF excitation block super–posed with TQF signal evolution and imaging readout. Due to delayed peak formation and slow signal decay, Cartesian (GRE) readout is well suited for sodium TQF imaging. For the decay–rate measurements the image encoding block was not executed during the acquisition. For further details about the TQF acquisition used in this work and its B0 and B1 stability, see reference (36).

